COMPANY SUMMARY
Reinsurance Group of America, Incorporated provides life and health, and asset-intensive reinsurance in the United States, Latin America, Canada, Europe, the Middle East, Africa, Asia, and Australia. It offers individual and group life and health, disability, long-term care, and critical illness reinsurance; and financial solutions, such as asset-intensive reinsurance, longevity reinsurance, stable value products, pension risk transfer transactions, and capital solutions. The company also provides reinsurance for mortality, morbidity, lapse, and investment-related risks; coinsurance of payout annuities; underwritten annuities; funding agreement backed note program and other capital motivated solutions; and superannuation. Reinsurance Group of America, Incorporated was founded in 1973 and is headquartered in Chesterfield, Missouri.
Financial Summary
| Share Statistics |
RGA |
Industry
Median |
Percentile
(All Stocks) |
| Market Cap (Mil) |
$17,419.2 |
$5,649.3 |
85% |
|
| Shares Out (Mil) |
66.0 |
77.9 |
54% |
|
| Institutional Ownership |
99.7% |
80.0% |
92% |
|
| Float (Mil) |
64.9 |
68.1 |
52% |
|
| Beta |
0.46 |
0.50 |
26% |
|
| Avg Daily Volume (000s) |
528 |
243 |
59% |
|
Price Change
(52-week) |
38.7% |
88.8% |
81% |
|
| Growth |
RGA |
Industry
Median |
Percentile
(All Stocks) |
| Sales (5yr) |
10.2% |
5.3% |
59% |
|
| Net Income (5yr) |
23.3% |
14.5% |
78% |
|
| EPS (5yr) |
22.9% |
15.6% |
73 |
|
| Dividends (5yr) |
5.4% |
4.0% |
96% |
|
| Cash Flow (5yr) |
(15.7%) |
(11.8%) |
47% |
|
| Estimates |
Qtrly |
Current
Fiscal
Year |
Next
Fiscal
Year |
| # of Estimates |
10 |
9 |
10 |
| Current EPS |
$6.936 |
$29.850 |
$29.970 |
| Month Ago EPS |
$6.909 |
$29.786 |
$29.701 |
| # Rev Up |
1 |
1 |
1 |
| # Rev Down |
0 |
0 |
0 |
| Three Months Ago EPS |
$6.795 |
$26.968 |
$29.248 |
| Year/Year Chg |
(1.1%) |
68.7% |
81.5% |
| Financials |
RGA |
Industry
Median |
Percentile
(All Stocks) |
| Sales (TTM) (Mil) |
$25,970 |
$4,725 |
93% |
|
| Net Income (TTM) (Mil) |
$1,508 |
$528 |
90% |
|
| EPS (TTM) |
$23.058 |
$2.500 |
98% |
|
| Operating Cash Flow (TTM) (Mil) |
$5,199 |
$559 |
95% |
|
| Net Cash Flow (TTM) (Mil) |
($128) |
$5 |
13% |
|
| Long-Term Debt (Q1) (Mil) |
$5,709 |
$917 |
87% |
|
| Enterprise Value (Q1) (Mil) |
$16,580 |
$7,271 |
81% |
|
| Valuation |
RGA |
Industry
Median |
Percentile
(All Stocks) |
| P/B |
1.27 |
1.58 |
36% |
|
| P/E |
11.7 |
11.6 |
26% |
|
| Dividend Yield |
1.5% |
1.0% |
72% |
|
| PEG (5yr hist) |
0.5 |
0.5 |
26% |
|
| Ratios |
RGA |
Industry
Median |
Percentile
(All Stocks) |
| Gross Margin |
14.1% |
35.3% |
13% |
|
| Net Margin |
5.8% |
10.3% |
50% |
|
| ROA |
1.0% |
2.5% |
46% |
|
| ROE |
11.7% |
14.8% |
62% |
|
| Liabilities to Assets |
91.8% |
77.7% |
89% |
|
| F-Score |
7 |
6 |
82% |
|
Passing Stock Screens
As of 10/16/2026, from a list of 60 stock screening strategies,
RGA meetings the criteria of 4 screen:
Stock Screen
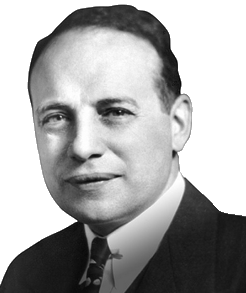
GURU STRATEGY
Graham--Defensive Investor (Utility) Screen
Factors: Yield, Value, Quality, Industry/Sector
Graham's approach leads to three separate screens that focus on the concept of intrinsic value, justified by a firm's financial strength.

GURU STRATEGY
Kirkpatrick Bargain Screen
Factors: Value, Momentum
Investing model outlined in Charles Kirkpatrick's book, Beat the Market: Invest by Knowing What Stocks to Buy and What Stocks to Sell.

FACTOR STRATEGY
P/E Relative Screen
Factors: Value, Earnings Estimates
A screen that looks at the relationship of a stock's price-earnings ratio to that of the industry and market.

FACTOR STRATEGY
Value on the Move--PEG With Hist Growth Screen
Factors: Value, Quality, Momentum, Growth
Using PEG ratios and price strength to find growth stocks trading at a reasonable price.


