
This week, Morningstar held its annual Investment Conference. Attended primarily by financial advisers, the conference is notable for both its size and its mutual fund focus (though there were sessions on other topics). This week, I’ll share some of my notes and observations. You’ll see a few articles resulting from meetings I had at the conference in future issues of the AAII Journal.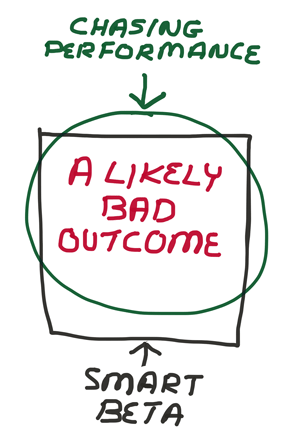
One of the topics brought up was smart beta, or as Morningstar refers to it, strategic beta. These strategies emphasize certain risk factors (stock characteristics shown to have a return premium associated with them). Rob Arnott of Research Affiliates and Cliff Asness of AQR Capital Management both cited value and momentum as factors that lead to higher stock returns. Asness does not see value, momentum and low volatility as being “arbitraged away soon.” He wasn’t sure about profitability, but described it as being interesting enough to look at over the long term. Though associated with a lower risk premium, he thinks the profitability factor is uncorrelated with value.
Arnott thinks investors should check “the price tag” of what they are buying, since factors can become overvalued when too many people are using strategies based on the same risk factor. He observed that people tend to pile into what has worked recently and shift out of what has hurt them recently. Arnott described this pattern as a sign that even though investors know they should buy low and sell high, they don’t do it. Arnott then added that the essence of successful investing is fighting against human nature.
William “Bill” Bernstein of Efficient Frontier Advisors (and a well-published author) expressed a similar view during a different session. When asked about smart beta strategies, he quipped that the real danger is when smart beta meets dumb money. He also thinks investors will pile out of these types of funds at the wrong time.
Regarding the market and economic environment, Michael Hasenstab of Franklin Templeton Investments shared a few insights about the macro environment. He blamed a mismatch between skills and job openings for keeping unemployment high and creating wage pressure (fewer skilled workers for employers to fill positions with). He explained that while China is experiencing a slowdown in its manufacturing sector, its services sector is growing. In regard to the bond market, Hasenstab pointed to past periods of mispriced yields ending with bubbles.
A day before the Federal Open Market Committee released its updated forecasts, Austan Goolsbee—a former chairman of the Council of Economic Advisors—singled out the Federal Reserve’s forecasts of 12-month growth as having been wrong for years. He thinks the problem is that the committee views 2006 as representing normal growth, which would assume a new housing bubble. Goolsbee’s expectation is for the economy to continue “plodding along” over the foreseeable future. He tried to console the audience by paraphrasing Warren Buffett: Look at where the Dow Jones industrial average was in 1900, where it is now and think about everything that has gone wrong in between—wars, influenza, Justin Bieber….
An assumption of lower rates of returns has led David Blanchett of Morningstar to lower his projections for the likelihood of a retiree not outliving his savings over a 30-year period using a 4% withdrawal rate with a 50% stock/50% bond portfolio. Rather than having a success rate (likelihood of not running out of money) in excess of 90%, he thinks it is now a coin toss. The reason is a lower assumed rate of return. Blanchett cautioned the financial advisers in the audience not to assume that low returns will continue forever, however.
In the same session, Jonathan Guyton of Cornerstone Wealth Advisors suggested using bands to adjust withdrawal rates in response to market conditions. These bands would start at 20% above and below the initial withdrawal rate and move upward as the withdrawal rate is adjusted in response to inflation. If the withdrawal rate hits the upper band, withdrawals are reduced by 10%. If the lower band is hit, the withdrawal rate is increased by 10%. The upper band would be hit if your portfolio fell in value due to a period of bad market returns. The reduction in wealth increases the percentage of total assets a certain dollar amount of withdrawal accounts for, thereby causing the upper band to be hit. In response, you would reduce the size of your withdrawal amount. The reverse would occur during periods of good market conditions.
Finally, William (“Bill") McNabb, the CEO of Vanguard, shared a few interesting observations. He doesn’t see liquidity being an issue in the bond market despite newer regulations (e.g., Dodd-Frank) and lower inventories at dealers that facilitate trades. Vanguard is working on new “holistic” tools for advisers to help the growing number of retirees with portfolio withdrawals. The company is also working on building simplified computer interfaces to help retirees better manage the savings they have accumulated in retirement savings accounts such as 401(k) plans. Regarding fees, he said the firm is not done cutting them.

- Weight by Fundamentals, Not by Price – Rob Arnott explained his approach to creating portfolios based on smart beta strategies.
- Exploring the Optimal Equity Allocation Path for Retirees – David Blanchett gave his rationale for why it makes sense to gradually reduce exposure to stocks heading into and throughout retirement.
- Micro-Cap Stocks Are Less Widely Followed, Offer Benefits – Michael Corbett of Perritt Capital Management makes the case for adding micro-cap stocks to a portfolio in this month’s issue.
- A Second Look at How Target Date Funds Change Their Allocations – At the Morningstar conference, Bill McNabb pointed to the success of target date funds as an example of how it’s difficult to predict what the next big innovation in the investment industry will be. Here’s an updated look at what target date funds do.
Following the June quarterly review, there are no changes to the Model Shadow Stock Portfolio. Four of the 30 stocks currently in the portfolio qualified for purchase at the end of May, down from five that qualified the previous month. They are designated as “qualified” in the notes column in the Actual Portfolio table.
The Model Shadow Stock Portfolio, which is a collection of micro-cap value stocks, fell 2.1% in May after posting three straight months of gains. Year to date, the portfolio is up 1.7%. In comparison, the Vanguard Small Cap Index fund (NAESX) was up 1.9% for May and is up 4.7% for the year. The DFA U.S. Micro Cap Index fund (DFSCX) gained 1.1% in May and is up 3.1% for the year. Since its inception in 1993, the Model Shadow Stock Portfolio has a compound annual average return of 15.2%, while the Vanguard 500 Index fund (VFINX) has gained 8.9% a year, on average, over the same period.
The Model Fund Portfolio’s 0.4% gain in May compares to a 1.8% gain for the Vanguard 500 Index fund. The Model Fund Portfolio has gained 3.3% year-to-date, while the Vanguard 500 Index fund is up 3.5%. Since its inception in June of 2003, the Model Fund Portfolio has a compound annual average return of 8.2%, matching the Vanguard 500 Index fund annual gain over the same period. No changes were made as the portfolio’s next quarterly review will not occur until July.
On Thursday, British voters will be asked “Should the United Kingdom remain a member of the European Union or leave the European Union?” BBC News has a good article explaining the upcoming Brexit referendum.
We’ll get our first glimpse at second-quarter results as a group of early reporters step up to the plate. Among them are S&P 500 members Adobe Systems (ADBE), CarMax (KMX), FedEx Corp. (FDX) and Lennar Corp. (LEN) on Tuesday; Bed Bath & Beyond (BBBY) and Red Hat (RHT) on Wednesday; and Accenture Plc (ACN) on Thursday.
The week’s first economic report will be May existing home sales, released on Wednesday. Thursday will feature the June Purchasing Managers’ Manufacturing Index (PMI) flash and May new home sales. May durable goods orders and June consumer sentiment will be released on Friday.
Two Federal Reserve officials will make public appearances: Chair Janet Yellen on Tuesday and Dallas president Robert Kaplan on Thursday.
The Treasury Department will auction $26 billion of two-year notes on Monday; $34 billion of five-year notes on Tuesday; and $13 billion of two-year floating rate notes (FRN), $28 billion of traditional seven-year notes and $5 billion of 30-year inflation-protected securities (TIPS) on Wednesday.
- 16 Financial Ratios for Analyzing a Company’s Strengths and Weaknesses
- Why a New Allocation Approach Is Needed
- Using Cash and Short-Term Bonds to Avoid Taking Losses in Retirement
Pessimism among individual investors is at its highest level and neutral sentiment is at its lowest level since February, according to the latest AAII Sentiment Survey. Optimism remains at an unusually low level.
Bullish sentiment, expectations that stock prices will rise over the next six months, declined 2.5 percentage points to 25.3%. This is the seventh time in the past eight weeks that fewer than three out of 10 survey respondents are optimistic. It is also the 32nd consecutive week and the 65th out of the past 67 weeks with bullish sentiment below its historical average of 38.5%.
Neutral sentiment, expectations that stock prices will stay essentially unchanged over the next six months, plunged 7.2 percentage points to 37.2%. Neutral sentiment was last lower on February 17, 2016 (34.6%). Even with the big drop, neutral sentiment is above its historical average of 31.0% for the 20th consecutive week.
Bearish sentiment, expectations that stock prices will fall over the next six months, surged 9.7 percentage points to 37.5%. Pessimism was last higher on February 17, 2016 (37.8%). The big jump put bearish sentiment above its historical average of 30.5% for just the third time in the 16 weeks.
The big jump in pessimism occurred as the major U.S. indexes pulled back from their recent highs. Many AAII members have previously expressed concerns about valuations and/or a potential drop in stock prices occurring. No members specifically mentioned last weekend’s shooting at the Orlando night club in response to this week’s special question, though global terrorism is having an impact on some members’ market outlook. The majority of this week’s votes were recorded prior to yesterday’s Federal Open Market Committee announcement, as the survey period runs from Thursday through Wednesday. As far as next week’s referendum on Great Britain’s membership in the European Union (“Brexit”), our survey suggests that individual investors are not considering it as part of their outlook for U.S. stocks.
Giving individual investors cause for concern is the slow pace of U.S. economic growth and uncertain pace of global economic growth, terrorism and global unrest, lackluster corporate earnings, the prevailing level of valuations, the forthcoming November elections and monetary policy. Some AAII members, however, are encouraged by sustained domestic economic growth, corporate earnings and the proximity of stock prices to their record highs.
This week’s special question asked AAII members how oil prices are affecting their outlook for the stock market. Slightly more than four out of 10 respondents (42%) said oil prices were not having an impact or were only having a small impact. Some pointed to the recent stabilization in oil prices, while others said they either don’t own oil stocks or don’t pay attention to the commodity. Nearly 16% said oil was having a positive impact, while the same number said oil was having a negative impact. Those who said oil prices were boosting their outlook pointed to the reduced volatility or viewed the rebound in prices as signaling economic growth. Those in the negative camp cited volatility in the commodity’s prices and the adverse impact on the economy. About 5% said that changes in oil prices move stock prices.
Here is a sampling of the responses:
- “A rising oil price would indicate improving demand and economic metrics.”
- “No impact absent any quick and sustained changes in oil prices.”
- “No effect except for oil producer stocks.”
- “Rising oil prices indicate increased demand as the world’s economies improve; a good scenario for market growth.”
- “Not much impact as oil prices seemed to have stabilized.”

Bullish: 25.3%, down 2.5 points
Neutral: 37.2%, down 7.2 points
Bearish: 37.5%, up 9.7 points
Bullish: 38.5%
Neutral: 31.0%
Bearish: 30.5%
Local Chapter Meetings

June 9, 2016 Where Is the Bond Armageddon?
June 2, 2016 Valuing Stocks Based on Their Dividend
May 26, 2016 The Most Tax-Efficient Investment
May 19, 2016 Crowdfunding Is Here; What You Need to Know

