


Economic reports and macroeconomic indicators are those often-voluminous statistics put out by government agencies, nonprofit organizations and even private companies. They provide measurements for evaluating the health of our economy, the latest business cycles and how consumers are spending and generally faring. Various key economic indicators are released daily, weekly, monthly and/or quarterly.
While it is important to keep a pulse on the economy, few analysts or economists wade through all of these massive volumes of data.
When you’re looking at economic indicators, it can be overwhelming to decide which reports are worth it—and why.
Here’s a primer on 10 of the most common and vital economic indicators. Even if you don’t follow these reports yourself, it is helpful to know where the “experts” are drawing their opinions from. If you do peruse this list of economic indicators, remember that data can change rapidly, and that broad trends are not judged by one isolated economic data point.
What Are Economic Indicators?
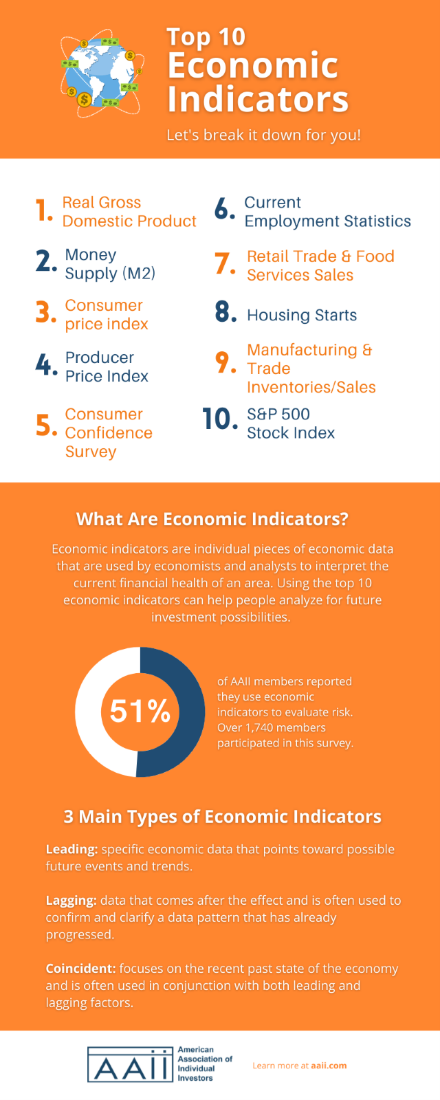
Economic indicators are individual pieces of data that are used by economists and analysts to interpret the current financial health of different aspects of the economy. Using the top 10 economic indicators can help people when analyzing for future investment possibilities.
There are three main types of economic indicators: leading, lagging and coincident. Each classification gives economists and investors insights on specific data points that reflect the financial health of an economy.
What are the leading economic indicators supposed to predict?
Leading economic indicators are analyzed by investors and shareholders who are looking for data that points toward possible future events and trends. Leading economic indicators assist policymakers and central bankers by providing information that helps them set and develop fiscal or monetary policy. On the other hand, businesses owners and investors use leading economic indicators to make strategic decisions as they anticipate how future economic conditions may affect markets and revenue. These leading economic indicators can help people stay on top of trends, especially when going into a new quarter or year.
What do lagging economic indicators tell us?
Lagging indicators are often used to confirm and clarify a data pattern that has already progressed. Many people tend to disregard lagging economic indicators and thus fail to notice key changing trends in the economy.
What are coincident economic indicators?
Lastly, coincident economic indicators focus in on the recent past state of the economy and are often used in conjunction with both leading and lagging factors. Coincident economic indicators give investors an idea about the overall business cycle—regular intervals of increase and decline—of the economy. This means that coincident economic indicators are the primary data points that can be used to illustrate if the economy is in a recession or expansion in a given time period.
Investors and analysts may use all three to get a full view of where the economy has been and how it is expected to change in the future.
List of the Top 10 Economic Indicators to Consider
Investors may focus in on certain economic indicators to analyze various markets in the past or present. The top 10 economic indicators are produced by both government and nonprofit organizations. We examine what they are, why they are important for analysts, how they’re formulated and where you can find them online.
1. Real GDP (Gross Domestic Product)
Analysts measure real gross domestic product (GDP) by looking at the amount of goods and services an economy produces in a specific period, accounting for inflation. Real GDP measures a society’s wealth by indicating how fast profits may grow and the expected return on capital. This lagging economic indicator is labeled “real” because it takes inflation into account: Each year’s data is adjusted to account for changes in year-to-year prices.
Why is real GDP an important economic indicator?
The real GDP is a comprehensive way to gauge the health and well-being of an economy since it indicates how fast profits are growing. The Federal Reserve uses data such as the real GDP and other related economic indicators to adjust its monetary policy.
How is real GDP formulated?
The U.S. Department of Commerce’s Bureau of Economic Analysis releases the data quarterly, including any revisions, within the last week to 10 days of each month following the end of the quarter. Data are spelled out as being “advance estimates,” “preliminary estimates” and “final” numbers. Each data release includes an explanation of why the GDP increased or decreased from the previous quarter (quarterly data are also annualized).
You can find this economic indicator by visiting the U.S. Bureau of Economic Analysis (BEA).
2. M2 (Money Supply)
An economy’s money supply (M2) represents the aggregate total of all money a country has in circulation. It takes into account all physical currency such as bills and coins; demand deposit savings and checking accounts; traveler’s checks; assets in retail money market accounts and small money market mutual funds (i.e., less than $100,000); individual time deposits and savings deposits, such as certificates of deposit (CDs); in addition to some repurchase agreements and Eurodollar holdings. It does not include institutional money fund assets, large denominated (more than $100,000) time deposits or any special reserves banks are required to maintain.
Why is M2 an important economic indicator?
The Federal Reserve uses this data to assess current economic and financial conditions and to help alter its monetary policy, which includes raising and lowering interest rates. The Fed’s actions are aimed at bolstering or reducing the money supply. The overall money supply is an important leading indicator because it signals that consumers and businesses have enough money to fund financial activities, creating a strong economy.
Economists and others also use M2 data to predict cyclical economic recessions and recoveries and expected changes in stock prices—not to mention expected changes in the Fed’s monetary policy.
The Fed and some economists and analysts pay attention to the longer-term trends in growth or reduction of the money supply, particularly the six-month figures. And the Fed retains its power to increase the money supply by lowering interest rates as a way to counter a sluggish economy, and to reduce the money supply by raising interest rates if the economy gets overheated.
Where does the data to formulate M2 come from?
The Board of Governors of the Federal Reserve System releases the data both weekly (on Thursdays) and monthly, during either the second or third week of the month. Monthly data goes back to January 1959; weekly information has been available since January 1975.
You can find information regarding an economy’s M2 or money supply by visiting the Federal Reserve’s website.
3. Consumer Price Index
The consumer price index (CPI) measures changes in the prices paid for goods and services by urban consumers for the specified month. The CPI is essentially a measure of individuals’ cost of living changes and provides a gauge of the inflation rate related to purchasing those goods and services. Because the CPI measures inflation rates, which can have a major impact on the overall economy, the CPI is a closely watched lagging indicator.
The CPI does not include every item an individual may buy, but instead takes a sampling of several hundred goods and services across more than 200 item categories. Data is collected through a series of interrelated surveys.
The CPI does not include income, Social Security taxes or investments in stocks, bonds or life insurance. But it does include all sales taxes associated with the purchases of those goods and services.
Why is the CPI an important economic indicator?
This statistic is the best indicator of inflation that we have to rely on. Changes in inflation can spur the Fed to take action to change its monetary policy.
Where does the data for the CPI come from?
The U.S. Department of Labor’s Bureau of Labor Statistics releases the national CPI—an average of all areas sampled—monthly, during the second or third week after the end of the measured month. CPIs for three specific metropolitan areas are also published monthly, while CPIs for other specific metropolitan regions are published every other month. Data releases include details about very specific products.
You can find this economic indicator by visiting the U.S. Bureau of Labor Statistics.
4. Producer Price Index
The producer price index (PPI) is a group of indexes that measures the changes in the selling price of goods and services received by U.S. producers over a period of time. Think of it as the business-side equivalent to the CPI that measures changes in prices paid by consumers: The PPI captures price movements at the wholesale level before price changes have bubbled up to the retail level.
The PPI tracks price changes in virtually all goods-producing sectors, including agriculture, forestry, fisheries, mining and manufacturing. The PPI also tracks price changes for a growing portion of the non-goods-producing sectors of the economy as new PPIs are introduced. Prices are tracked monthly.
This report measures prices for goods at three stages of production: finished goods, intermediate goods and crude goods. The PPI was called the Wholesale Price Index from 1902 until 1978.
What makes the PPI a leading economic indicator?
This index is timely because it is the first inflation measure available in the month. In addition, by watching crude prices, which are first in the chain of production trends, one can sometimes spot inflation in the pipeline, before it shows up in the CPI. The PPI is considered to be a leading economic indicator.
Who formulates the PPI?
The U.S. Department of Labor’s Bureau of Labor Statistics releases the data monthly, during the second full week of the month following the reporting month.
You can find more information about the producer price index on the U.S. Bureau of Labor Statistics website.
5. Consumer Confidence Survey
The consumer confidence survey is a gauge of the public’s confidence about the health of the U.S. economy that reflects the public’s optimism/pessimism and the nation’s mood.
Five questions are asked of a random sampling of individuals. The survey asks their thoughts and feelings about business conditions, the labor market, consumer spending, economic growth and their financial and employment expectations six months into the future. Each question can be assigned one of three opinions: positive, negative or neutral.
Why is the consumer confidence survey important?
This statistic is a leading indicator of consumer spending. Consumers are more inclined to spend money when they are feeling confident about their financial and employment prospects.
Where does the data from the consumer confidence survey come from?
The Conference Board’s Consumer Research Center releases the data monthly on the last Tuesday of each month.
You can find more information about the consumer confidence survey by visiting The Conference Board’s website.
6. Current Employment Statistics
The Current Employment Statistics (CES) program provides comprehensive data on national employment, unemployment and wages and earnings data across all non-agriculture industries, including all civilian government workers. Information is disseminated in many different ways—for example, employment/unemployment rates among men and women, varied ethnic groups and teens.
Employment data is based on a survey that accounts for approximately one-third of all payroll employees. Industries include retail trade, manufacturing and construction. CES provides details on numbers of hours worked and earnings of all surveyed across the nation.
The “employed” are defined as all full- and part-time workers and temporary and intermittent employees who received pay for the cited period. It includes those on paid vacation or sick leave, and excludes business proprietors, self-employed, unpaid family members and volunteers.
Why is the Current Employment Statistics program important?
Current employment statistics are the earliest indicators of economic trends released each month. Employment rates indicate the well-being of the economy and labor force. Changes in wages point to earnings trends and related labor costs. Economists focus on the monthly change in total non-farm payrolls and in which sectors jobs were gained or lost.
Interesting trends can also be derived from the payroll data, such as the average number of hours per week worked and the average hourly earnings. This data gives an indication of how tight the labor market is since tight labor markets can translate into wage inflation. Because of these important data points, current employment statistics, especially the unemployment rate, are considered lagging economic indicators.
Where does the data for Current Employment Statistics come from?
The U.S. Department of Labor’s Bureau of Labor Statistics releases the data monthly, usually on the first Friday following the reference month, but always within the first 10 days after month-end.
You can find more information about current employment statistics by visiting the U.S. Bureau of Labor Statistics.
7. Retail Trade and Food Services Sales
Retail trade and food services sale data tracks monthly U.S. retail and food service sales, details changes from previous periods and identifies in which sectors sales increased and/or decreased.
The data is based on a random sampling of retail and food service firms. Figures are broken out to both include and exclude sales of automobiles. Sales are weighted and benchmarked to represent the nation’s retail and food services firms.
Why are retail trade and food service sales data important?
The numbers measure consumers’ personal consumption across retail industries and track growth or deceleration of personal consumption spending, which makes up approximately 70% of the annual U.S. GDP. Analysts use the data to help track consumer spending trends and forecast the direction and magnitude of future spending. Automobile sales are separated from the data because of their volatility, which can sometimes obscure the underlying pattern of spending.
Where does retail trade and food service sale data come from?
The U.S. Department of Commerce’s U.S. Census Bureau releases the data monthly, during the second week of each month.
You can find more information about retail trade and food service sale data by visiting the U.S. Census Bureau.
8. Housing Starts
Housing starts, formally known as New Residential Construction, configures the approximation of the number of housing units on which some construction was performed during the month. Data is provided for single-family homes and multiple unit buildings. The data indicates how many homes were issued building permits, how many housing construction projects were initiated and how many home construction projects were completed. Housing starts is a leading economic indicator because this data indicates whether builders are optimistic about the area’s financial health and gives perspective about future events.
Why is analyzing housing starts data important?
The number of housing starts is highly sensitive to changes in mortgage rates, which are affected by changes in interest rates. Although this indicator is highly volatile, it represents about 5% of annual GDP and can signal changes in the economy and the effects of current financial conditions. Analysts and economists know to watch for longer-term trends in housing starts.
Where does the housing starts data come from?
The U.S. Department of Commerce’s U.S. Census Bureau releases the data monthly, within two to three weeks after the end of the reporting month.
You can find more information about housing starts and new residential construction data by visiting the U.S. Census Bureau website.
9. Manufacturing and Trade Inventories/Sales
The manufacturing and trade inventories as well as sales represent the combined value of trade sales and shipments by manufacturers in a specific month. Additionally, it highlights the combined values of inventories in the wholesale and retail business sectors and manufacturing. The current and most recent past month’s inventory/sales ratios are also provided.
Why is looking at manufacturing and trade inventories and sales important?
This data set is the primary source of information on the state of business inventories and business sales. Inventory rates often provide clues about the growth or contraction of the economy. A growth in business inventories may mean sales are slow and the economy’s rate of growth is also slowing. If sales are slowing, businesses may be forced to cut production of goods and that can eventually translate into inventory reductions.
Where does the data of manufacturing and trade inventories and sales come from?
The U.S. Department of Commerce’s U.S. Census Bureau releases the data monthly, approximately six weeks after the end of the subject month.
You can find more information about manufacturing and trade inventories and sales by visiting the U.S. Census Bureau.
10. S&P 500 Index
The S&P 500 index is a market-value-weighted index of the largest 500 publicly owned stocks combined into one equity basket. This basket of stocks has become the industry standard and benchmark for the overall performance of the U.S. equity markets.
The S&P Index Committee chooses the stocks for the index based upon market size, liquidity and industry group representation. Component companies are periodically replaced. Companies are most often removed because of a merger with another company, financial operating failure or restructuring. Prospective companies are placed in an index “replacement pool” and vacancies are filled from that pool.
Why is analyzing the S&P 500 important?
The index is designed to measure changes in the stock prices of component companies. It is used as a measure of the nation’s stock of capital, as well as a gauge of future business and consumer confidence levels. Growth of the S&P 500 can translate into growth of business investment. It can also be a clue to higher future consumer spending. A declining S&P 500 can signal a tightening of belts for both businesses and consumers. The S&P 500, as well as the Nasdaq composite and the Dow Jones industrial average are all considered to be leading economic indicators because they reflect investor confidence within the largest companies in the U.S.
Economists tend to look for long-term trends rather than short-term fluctuations in the S&P 500. The S&P 500’s 10-year total return, for example, has become a common indicator of longer-term trends.
Where does the data for the S&P 500 come from?
Standard & Poor’s is solely responsible for compilation of the S&P 500. However, real-time information on the index is available daily from financial news organizations and publications, as well as from Standard & Poor’s.
You can find more information about how to analyze the S&P 500 as a leading economic indicator at S&P Global Ratings.
See how AAII members evaluate economic risks before investing.
Using a Top 10 List of Economic Indicators When Investing
Understanding how you can use the top 10 economic indicators to invest with confidence is key. Knowing how to apply these crucial data points to make informed decisions can help you analyze past and future information.
With AAII’s numerous resources and services, you can take the important top 10 economic indicators and apply them to your prospective investment candidates. Track market securities with countless stock screens, power rankings, fund evaluators and more to always stay on top of market fluctuations.
Subscribe to A+ Investor if you want in-depth access to our most highly rated tools. Don’t wait for the right time to invest, learn how to predict future changes and manage your portfolio all in one convenient location.
Subscribe to A+ Investor and Become an AAII Member Today
This article was originally published in the August 2003 AAII Journal. Click here for a PDF of the original article. The article was originally prepared by the Association for Investment Management and Research (AIMR), a non-profit professional association of 60,000 financial analysts, portfolio managers and other investment professionals in 112 countries. The AIMR changed their name to CFA Institute in 2004; www.cfainstitute.org.
Kelvin from OH posted over 14 years ago:
Jayantilal Patel from PA posted over 13 years ago:
Barb & Doug Burtwell from WA posted over 13 years ago:
Jeffry Deegan from RI posted over 13 years ago:
Joseph Yurso from VA posted over 13 years ago:
Ray Beall from TX posted over 13 years ago:
Sheryl Parks from NV posted over 13 years ago:
Melvin Moore from VA posted over 13 years ago:
Michael Mckeown from FL posted over 13 years ago:
John L from NC posted over 13 years ago:
Norman Koerner from IL posted over 13 years ago:
Charles Rotblut from IL posted over 13 years ago:
Sanford Levey from MA posted over 10 years ago:
J Traeger from CA posted over 9 years ago:
Mark Cigainero from TX posted over 9 years ago:
You need to log in as a registered AAII user before commenting.
Log InCreate an account