


Related

First Cut Stocks
Seventy-eight percent of the stock screens AAII tracks posted gains during 2025, with an average gain of 14.7%.

AAII has been developing, testing, refining and tracking a variety of quantitative stock strategies for over 25 years using Stock Investor Pro, AAII’s fundamental stock screening and research database program. These screens are designed to explore and explain which quantitative fundamental factors help identify promising investment candidates.
AAII tracks the performance of the stocks passing these screens over time to help users understand how the various approaches work in different market environments and which types of stocks each screen tends to filter. This annual recap provides a view into the strongest- and weakest-performing strategies for the past year with the goal of understanding any common themes that can help investors successfully use stock screens.
Companion articles to the 2025 Review of AAII Stock Screens
In 2025, the financial markets were shaped by a powerful mix of monetary policy expectations, technological enthusiasm, and shifting political and global dynamics. Investors spent much of the year anticipating Federal Reserve interest rate cuts, which helped support equity valuations by easing financial conditions and lowering borrowing costs. At the same time, optimism around economic growth remained resilient, despite lingering inflation concerns supported by a still-tight labor market. However, uncertainty around immigration and labor supply policy raised periodic doubts about whether inflation pressures could reemerge.
Technology stocks were the standout leaders, fueled by sustained enthusiasm for artificial intelligence (AI). AI-related investments drove strong gains across the information technology sector, even as bouts of volatility—most notably in high-profile companies like Nvidia Corp.  (NVDA)—reminded investors of the risks embedded in elevated valuations. This innovation-led surge allowed the information technology sector to outperform the broader S&P 500 index for much of the year, though leadership broadened at times as the health care and communications sectors also delivered solid returns.
Political and policy developments added another layer of volatility. The return of the Trump administration brought renewed focus on tariffs and potential tax extensions, leading to sharp market swings as investors reacted to policy headlines. Expectations for a generally pro-market stance—lower taxes and reduced regulation—helped sustain investor optimism, reinforcing the idea of an implicit “Trump put” under assets.
Beyond U.S. equities, global markets and alternative assets played an increasingly important role. International stocks delivered strong relative performance in several periods, while commodities benefited from both inflation-hedging demand and geopolitical risk. Gold reached record highs, and oil prices remained volatile amid geopolitical tensions such as the Israel-Iran war, though energy prices stayed well below their 2022 peaks. Together, these crosscurrents defined 2025—a year marked by strong returns, shifting leadership, and a constant balancing act between optimism and policy-driven uncertainty.
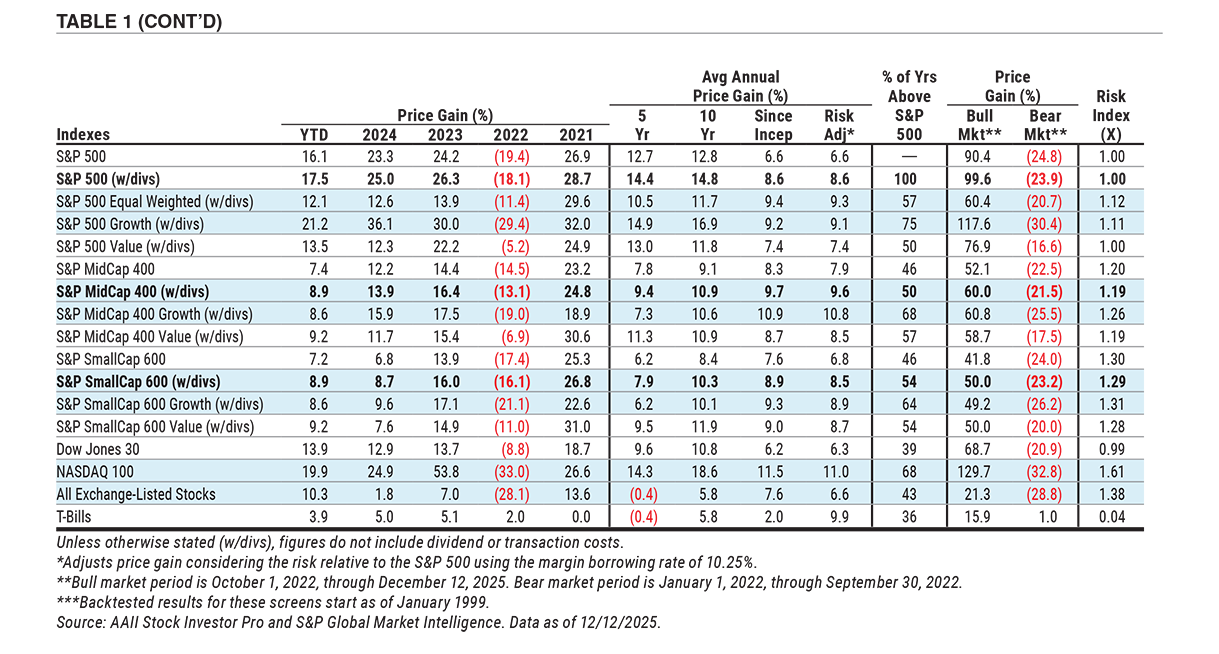
The S&P 500 had a total return of 17.5% year to date through December 12, 2025, compared to total returns of 8.9% for both the S&P MidCap 400 index and the S&P SmallCap 600 index. Growth stocks outperformed value stocks among larger firms, while value edged out growth within the mid- and small-cap universes.
Seventy-eight percent of the 55 stock screens AAII tracks posted gains during 2025, up from 71% during 2024. Screens gained an average of 14.7% during 2025, compared to 14.9% in 2024.
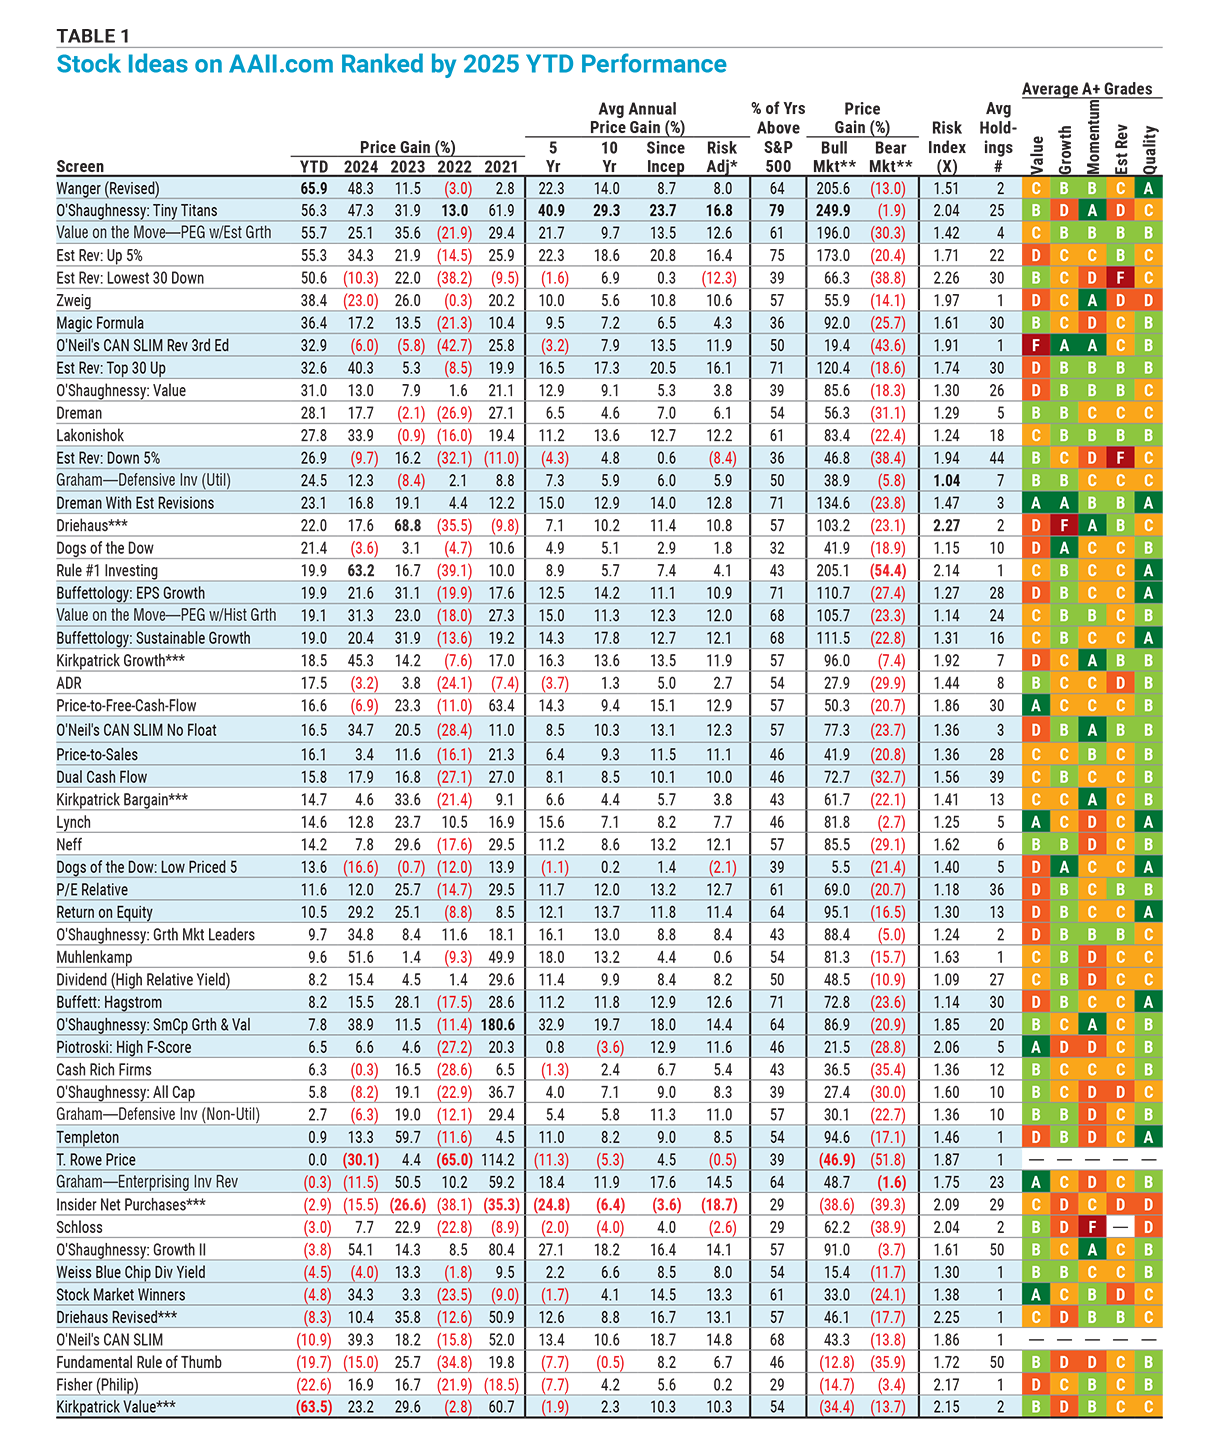
Table 1 summarizes the performance and variability of the screening strategies that AAII tracks, ranked in descending order by year-to-date price change through the close on December 12, 2025. (See the AAII Stock Ideas box for more information about how we track and calculate performance.) The table presents price change performance (excluding dividends and transaction costs such as commissions, bid/ask spreads, time and price slippage, etc.) over various periods for each approach. The Average A+ Grades for the recent stocks passing these screens reveal how the companies passing each screen compare when it comes to value, growth, price momentum, earnings estimate revisions and surprises, and quality. The table also provides data for a range of market indexes to help understand the current and long-term market environment in which these strategies performed.
Download the Excel spreadsheet of Table 1.
The Price Gain and Average Annual Price Gain columns in Table 1 represent the annualized percentage price gain or loss realized by a hypothetical portfolio invested in the stocks passing each screen over varying periods from January 1, 1998, through December 12, 2025. Note that six screening strategies, footnoted in the table, make use of data elements that we did not have in our dataset until 1999. Their long-term performance and risk-adjusted returns do not include 1998 performance—a year in which large-cap growth strategies did well.
These performance figures for the screens only represent price change and do not include dividend payments or dividend reinvestment. Therefore, the results of screens that tend to highlight large, dividend-paying stocks—such as the Dogs of the Dow screen—do not receive a boost from dividend payments or reinvestment. The 10 stocks passing the Dogs of the Dow screen as of December 12, 2025, yield an average of 2.9%. Therefore, investors holding shares in these stocks would have a higher annual return by approximately this amount for 2026.
While 43 of the 55 screens tracked on AAII.com were up for the year, only 25 outperformed the S&P 500’s 16.1% price gain through December 12, 2025. The median price gain of all AAII Stock Screens was 14.7% for the year. By comparison, the screens had a median gain of 15.4% in 2024, while the S&P 500 gained 23.3% and the average exchange-listed stock rose 1.8%. The average exchange-listed stock was up 10.3% in 2025 as of December 12.
Most of the 55 stock screening strategies that AAII tracks have posted gains over the last five- and 10-year periods. Thirteen screens show a loss for their average annualized price gain over the last five years, while five screens were in the red over the last 10 years.
Interestingly, 18 of the 55 screening methodologies AAII tracks posted better price returns than the S&P 500 over the last five years, but only 14 posted better results than the S&P 500 over the last 10 years. The screens tend to include mid-sized or smaller companies, while large-cap growth has been the dominant approach over the last 10 years.
All of the screens and their monthly results are presented on the All Screens page of AAII.com. If you find an approach interesting, you can favorite the screen by clicking on the star next to its name. This feature makes it easy to follow specific screens and gain additional insight via the My Screens tool on the new AAII Investor Hub, which is available to all AAII members. (See the How-To article in this issue for details on this new feature.)
The five most-tracked screens by AAII members are: O’Shaughnessy Tiny Titans, O’Shaughnessy Small Cap Growth & Value, Buffettology Sustainable Growth, Buffett Hagstrom and O’Neil CAN SLIM Revised 3rd Edition. Not surprisingly, Estimate Revisions Lowest 30 Down is the least-favorited screen.
For 2025 through the close on December 12, the top AAII stock screening strategy is our interpretation of Ralph Wanger’s investing approach, up 65.9% for the year.
A successful small-cap money manager, Wanger started The Acorn Fund in 1970 and later founded Wanger Asset Management. Wanger’s investing approach focuses on identifying established small-cap companies that hold dominant positions within specific market niches and are positioned to benefit from long-term themes or trends expected to last at least four to five years. Using a contrarian philosophy that he likens to a “zebra standing outside the herd,” Wanger seeks companies with proven management, strong financial health (including low debt levels, adequate working capital and positive operating cash flow), and above-average operating margins and sales growth relative to their industries.
He emphasizes purchasing these quality small-cap stocks at reasonable valuations, specifically targeting companies with price-earnings-to-earnings-growth (PEG) ratios below 1.0 but above 0.2. Additionally, Wanger avoids start-ups, initial public offerings (IPOs) and turnaround situations.
The strategy requires a long-term investment horizon of several years to offset the illiquidity and higher transaction costs inherent in small-cap investing. Thus, it also requires the discipline to hold positions as long as the original investment thesis remains valid. See the article “Inside the Wanger Revised Screen’s 2025 Outperformance” in this issue for more about the Wanger approach.
AAII has performance history for most of its stock screens dating back to 1998, spanning 28 years. The O’Shaughnessy Tiny Titans screen boasts the best long-term performance, delivering a 23.7% annual price gain since inception. Developed from James O’Shaughnessy’s book “Predicting the Markets of Tomorrow: A Contrarian Strategy for the Next Twenty Years,” the screen is tailored for aggressive investors seeking undervalued micro-cap stocks with upward price momentum.
O’Shaughnessy highlights that micro-cap stocks often lack analyst coverage, creating opportunities for substantial gains when these overlooked stocks perform well. These stocks also have a low correlation with the S&P 500, which primarily consists of mid- and large-cap companies. However, O’Shaughnessy cautions that micro-caps are highly volatile, making them suitable only for investors comfortable with significant portfolio swings. The Tiny Titans screen focuses on micro-cap stocks with low price-to-sales (P/S) ratios and strong 52-week relative price strength. Impressively, the strategy has outperformed the S&P 500 in 79% of individual calendar years.
Table 1 also presents the risk-adjusted return for each of the strategies that AAII tracks. This calculation adjusts the performance of each approach using its volatility as measured through standard deviation of returns, penalizing screens with higher standard deviations. (For a more detailed explanation of the risk-adjusted return calculation, see the Calculating Risk-Adjusted Return box.) Using risk-adjusted returns since inception (1998), the best-performing strategy is still the O’Shaughnessy Tiny Titans, with a risk-adjusted gain of 16.8%, even though it has a high risk index of 2.04.
Six of the 55 AAII stock screening strategies had negative average annual risk-adjusted returns from inception through 2025. The Insider Net Purchases strategy has the weakest risk-adjusted return. The higher level of risk for this approach lowered its absolute loss of 3.6% since inception to a risk-adjusted loss of 18.7%.
The formula for calculating the risk-adjusted return is as follows:
Margin Rate + (Benchmark Std Dev ÷ Portfolio Std Dev) x (Portfolio Return – Margin Rate)
Where:
This calculation assumes that the portfolio return for a given stock screen is higher than the margin rate. If it isn’t, the risk-adjusted return calculation would be as follows:
Margin Rate + (Portfolio Std Dev ÷ Benchmark Std Dev) x (Portfolio Return – Margin Rate)
Following this methodology, we calculate the risk-adjusted returns since inception for all of the AAII Stock Screens.
The majority of stocks are positively correlated with the overall market: When the market rises, most stocks follow, and during downturns, their values decline. By analyzing stock screen performance during recent bull and bear markets, we can assess a strategy’s ability to capitalize on uptrends and limit losses during downturns.
Following the long bull market from 2009 to 2020, we have seen a rapid succession of bull and bear periods. The latest bear market spanned the first nine months of 2022, while the current bull market began on October 1, 2022, and has continued through December 12, 2025. The market came close to registering a 20% drop this past year when it was surprised by the severity of the initial tariff announcement. But, it bounced back and continued its climb as the Trump administration softened its proposals.
During the current bull market, the S&P 500 posted a price gain of 90.4%, while the S&P SmallCap 600 gained 41.8%. The top-performing screen was the O’Shaughnessy Tiny Titans approach, which surged 249.9%, while the T. Rowe Price screen was the worst-performing strategy, down 46.9%. Very few companies, if any, passed the screen during this period.
In the last bear market (January 1, 2022, to September 30, 2022), the Graham Enterprising Investor Revised screen had the smallest loss, declining just 1.6%, while the Rule #1 Investing approach experienced the largest loss, down 54.4%.
Strategies that performed best in the bear market often include a dividend component, which can provide price support during downturns as investors seek conservative, income-generating stocks.
The risk index measures the variability of returns for a stock screening strategy relative to a benchmark. It is calculated by dividing the standard deviation of a strategy’s returns by the standard deviation of the benchmark’s returns—in this case, the S&P 500. Standard deviation, which measures return volatility, is based on monthly returns since the beginning of 1998.
The risk index provides a relative measure of risk. The S&P 500 has a risk index of 1.00. Strategies with a risk index below 1.00 are considered less risky than the benchmark, while those above 1.00 carry higher risk.
All of AAII’s screens have risk indexes above 1.00, which is expected. Stock screens typically pass a small set of stocks—anywhere from a handful to around 50—whereas the S&P 500 consists of 500 actively traded companies. The Graham Defensive Investor Utility approach has the lowest risk index at 1.04. The screen focuses on “safer” dividend-paying utility stocks.
On the other end of the spectrum, the Driehaus screen has the highest risk index of 2.27. This screen seeks out smaller growth companies with recent positive earnings surprises and positive price momentum.
A key benefit of quantitative stock screening is its ability to narrow down a large universe of stocks to a more manageable list. For screens to be effective, they should yield enough passing stocks to provide alternatives, but not so many that investors become overwhelmed.
The average number of passing stocks reflects how many stocks typically pass a filter each month, though this can vary with market cycles. For example, the top-performing Wanger Revised screen for 2025 currently has eight passing stocks but has averaged just two over time. When only a small number of companies pass a filter, the resulting performance tends to be more volatile and can deviate significantly from the broader market.
The stock screening strategies presented here illustrate how different filters and strategies perform under various market conditions. They are not portfolios or buy recommendations. Instead, view them as idea generators and conduct thorough analysis before committing real capital. Because market conditions change, it is also essential to maintain proper diversification.
Building a portfolio from a stock screen involves multiple steps. Beyond quantitative filters, investors must perform additional research to ensure a stock is a good fit. This includes qualitative analysis, such as reviewing earnings call transcripts, assessing management guidance and checking relevant company news. A stock passing a screen does not automatically make it a strong investment. Quantitative screening is just the starting point. Changing economic conditions can influence a strategy’s performance in the short term, making it critical to stay informed about market trends.
To achieve effective diversification, consider stocks from multiple screening methodologies. However, selecting strategies based solely on long-term performance is not enough. Understand the factors driving both overall market trends and a strategy’s results, as well as how economic shifts can impact individual stocks. Examining a methodology’s characteristics can also reveal practical challenges when translating quantitative screens into real-world portfolios.
Finally, remember that quantitative filters identify candidates with shared characteristics but don’t guarantee strong investments. Investors must apply qualitative analysis to determine whether a stock aligns with their portfolio goals and risk tolerance. Combining quantitative screening with thoughtful fundamental research is essential to building a well-rounded investing strategy.
AAII has been developing, testing and refining a wide range of screening strategies over the years. Many of the screens follow the approaches of well-known investing professionals, while others are tied to fundamental investing principles. These approaches run the full spectrum, from value-based strategies to those that focus primarily on growth, while most fall somewhere in the middle. Screens following the approach of an investing professional do not represent their actual stock picks. The rules of each screen are defined by our interpretations of their respective investing philosophies.
The results of the screening strategies, and the criteria for each screen, are programmed into Stock Investor Pro, AAII’s fundamental stock screening and research database. Passing companies and screening results can also be accessed by all AAII members via AAII.com. The screening results are found on the Stocks page of AAII.com. Members can rank the screens using the Screen Power Rankings tool and favorite screens to track passing companies via the My Screens feature. Performance statistics on the screens can be accessed directly via the AAII Stock Screens section within the Stocks menu or the new AAII Investor Hub.
The performance of stocks passing each screen is tracked monthly. We use month-end closing prices to calculate returns, assuming equal investments in each stock at the beginning of each month. Factors such as commissions, bid/ask spreads, time slippage (the time between the initial decision to buy a stock and the actual purchase) and taxes are not considered. This overstates the reported performance, but all approaches are subject to the same conditions and procedures. Higher-turnover portfolios typically benefit more from these simplified rules. Keep in mind, however, that performance figures for AAII stock screening strategies represent price change only and do not include dividend payments or dividend reinvestment. Therefore, performance figures for screens that tend to identify large, dividend-paying stocks—such as the Dogs of the Dow—do not receive a boost from dividend payments or reinvestment.
The sell rules mirror the buy rules: The hypothetical portfolios are completely reallocated each month using updated data. A stock is removed from the portfolio if it no longer meets the initial criteria, and new stocks are added if they qualify. Note that we use these rules for backtesting purposes but do not necessarily advocate them as part of a real-world investing framework. Stocks that no longer qualify are dropped even if the strategist behind a particular approach suggests different sell rules. This may shorten the holding period and increase turnover relative to what the strategist would suggest for an actual portfolio.
First Cut Stocks

AAII Stock Ideas

AAII How-To

JOHN L from NJ posted 8 months ago:
BARRY J from TX posted 8 months ago:
You need to log in as a registered AAII user before commenting.
Log InCreate an account