


Related

Portfolio Strategies
A new policy of some index funds to allow nondiversification status exposes investors to concentration risk.

Vanguard recently announced a change to the diversification policy for several of its exchange-traded funds (ETFs), including its popular Vanguard S&P 500 ETF  (VOO). In a supplement to the prospectus dated June 28, 2024, the firm noted, “Under the revised policy, the Fund will continue to track its target index even if the Fund becomes nondiversified as a result of an index rebalance or market movement.” This change serves as a useful reminder for all of us—not just those who invest in the affected Vanguard funds—that increasing fund concentration comes with risk.
The change was made in response to the sharp price appreciation of a small number of stocks, which now represent a significant proportion of certain indexes. While an index’s increasing exposure to a handful of stocks has no regulatory impact, since indexes themselves are not subject to the U.S. Securities and Exchange Commission’s (SEC) rules, there are implications for funds that seek to track the performance of these indexes. As funds track benchmarks increasingly dominated by a handful of large-cap companies, their portfolios become more concentrated, which can result in regulatory headaches for diversified funds.
Equity index funds strive to match the performance of their benchmark index, such as the S&P 500 index. To accomplish this, they typically replicate the index by owning all of the benchmark’s constituent stocks. The weight of each holding corresponds to its market capitalization, although other weighting schemes exist, as I discuss below. Failure to match the index’s weighting scheme can cause the fund’s performance to deviate from that of the index—a result referred to as tracking error. Index funds, by their definition, are expected by investors to have a very low tracking error.
Since funds are regulated by the SEC, they must comply with regulatory guidelines in order to be considered diversified. Under the rule, no more than 5% of a fund’s assets can be invested in any single security, and no more than 25% of the portfolio can be allocated to large concentrations across 10 or fewer stocks. Vanguard’s announcement indicates that its funds will no longer adhere strictly to these limits, allowing them to continue closely tracking the indexes’ concentrated exposure to top-performing stocks.
By being classified as nondiversified, an index fund such as the Vanguard S&P 500 ETF can continue to hold all the stocks in the index in the same proportions as in the index. The consequence for investors is that while an index fund’s tracking error can remain comparatively low as it maintains exposure to the largest companies in the index, doing so can increase the fund’s exposure to a small number of large stocks. This can be a positive while those large companies perform well, but concentrated holdings could magnify losses in a market downturn. Table 1 shows the 10 largest holdings in the Vanguard S&P 500 ETF as of August 31, 2024, and their respective weights in the fund.
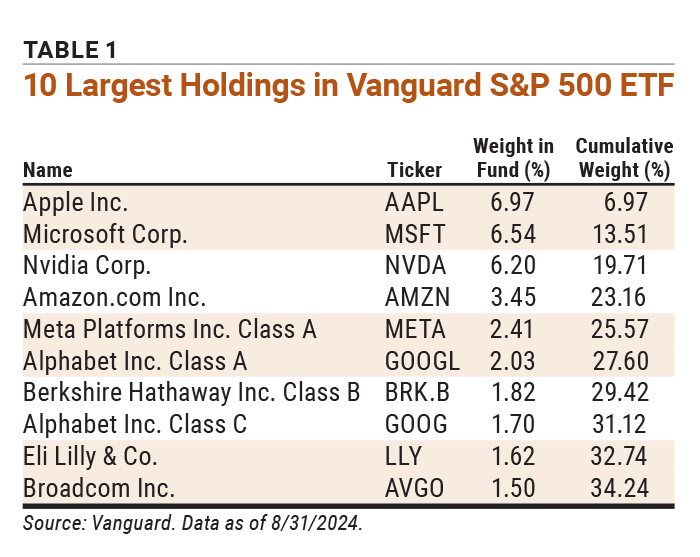
As I discussed in my June 2024 AAII Journal article, “Active Investors Can Still Win in ‘Efficient’ Markets,” much of the S&P 500’s return can be attributed to a small number of stocks. As can be seen from Table 1, some well-known technology stocks are among the top 10 holdings of the Vanguard S&P 500 ETF.
Indeed, in recent years much of the performance of the S&P 500 can be traced to seven large technology stocks, known as the Magnificent Seven. This group comprises Alphabet Inc. (GOOGL), Amazon.com Inc. (AMZN), Apple Inc. (AAPL), Meta Platforms Inc. (META), Microsoft Corp. (MSFT), Nvidia Corp. (NVDA) and Tesla Inc. (TSLA). Driven by the growth of new technologies, including artificial intelligence (AI), the tech sector has been a major source of performance, with the Magnificent Seven in particular producing spectacular gains for investors. From January 1, 2023, through August 31, 2024, for example, an equally weighted portfolio of these seven stocks returned 180%, in contrast to the 51% total return of the S&P 500, as Figure 1 shows.

The S&P 500 is a market-cap-weighted index, meaning that the weight of a stock in the index is a function of its market value. If one stock in the index performs better than another, its weight will increase and that of the other will decrease. Over time, the best-performing stocks account for an increasing proportion of the index. While this means that the index benefits from the price appreciation of these high-flying stocks, it also means that the index becomes increasingly risky as these stocks become more highly valued and potentially overvalued.
Figure 2 illustrates this. The S&P 500 Top 10 index, which consists of the 10 largest stocks in the S&P 500 and is reconstituted annually, has returned 455% over the last 10 years. In contrast, the S&P 500 has returned 239% over the same period.
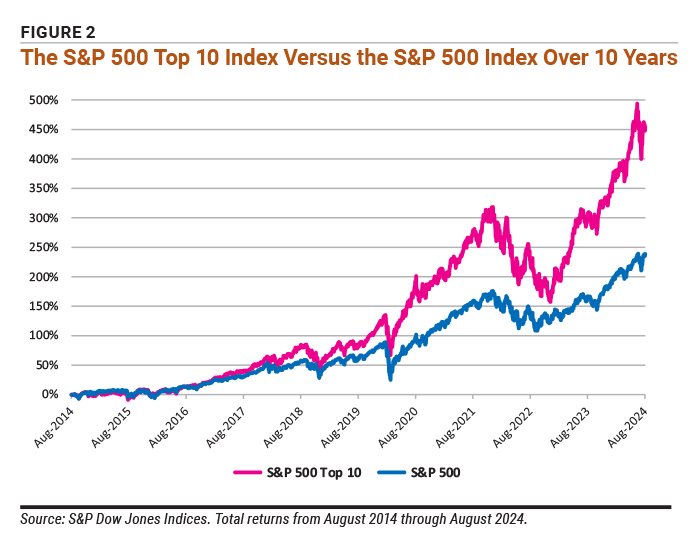
Because market-cap-weighted indexes are most influenced by the largest companies, those indexes benefit from continued appreciation by those firms in bull markets. In bear markets, this concentration can have negative consequences for index performance, particularly if the larger firms suffer above-average losses. This can often be the case if those large stocks became overvalued. In such scenarios, equal-weighted funds—in which each member stock is equally weighted rather than being weighted by market value—can outperform their market-weighted peers.
The top chart in Figure 3 shows the comparative total returns of the Invesco S&P 500 Equal Weight ETF (RSP) and the SPDR S&P 500 ETF Trust (SPY) from January 2023 through August 2024. The market-cap-weighted SPDR S&P 500 ETF outperformed, returning 51% in contrast to the 28% returned by the Invesco S&P 500 Equal Weight ETF.
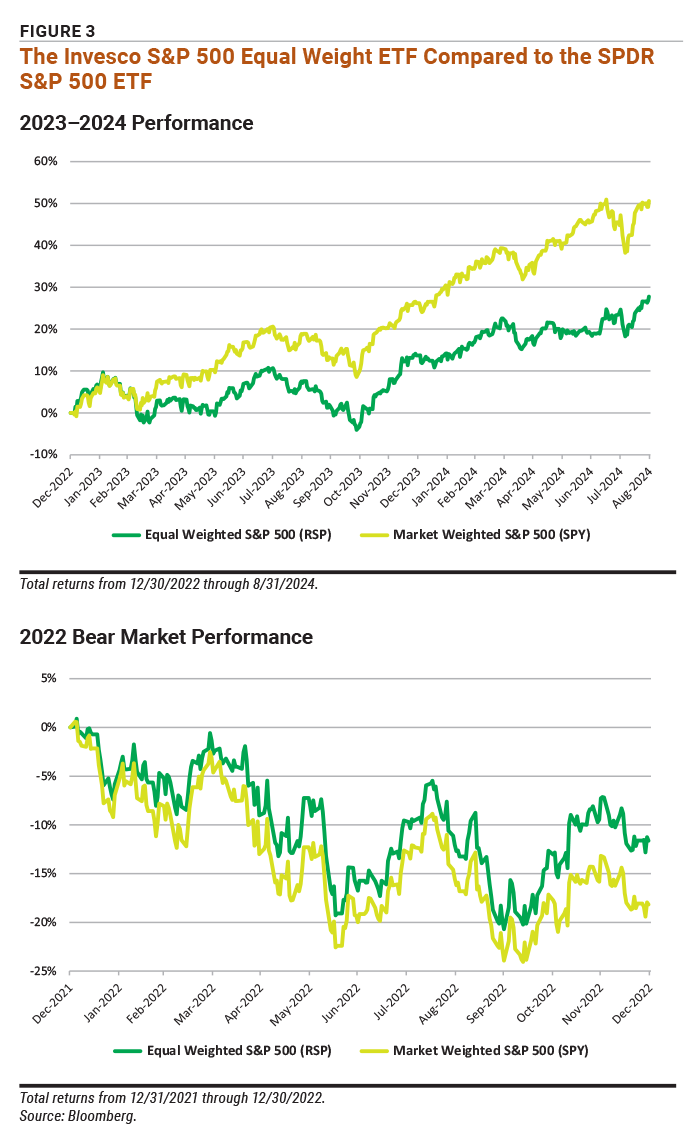
However, during the market sell-off in 2022, the Invesco S&P 500 Equal Weight ETF outperformed, suffering a loss of 11.6%. This was smaller than the 18% loss experienced by the market-weighted SPDR S&P 500 ETF, as illustrated in the bottom chart in Figure 3.
For individual investors, the difference between the two weighting schemes is important. Market-cap-weighted indexes can enhance returns in bull markets, but their reliance on a small number of large names can increase risk and the potential downside in a sell-off. Given this, investors should consider their risk-reward preferences even when choosing index mutual funds and ETFs.
Rather than equally weighting a portfolio or weighting by market cap, some funds pursue smart beta (aka factor) strategies. These funds include the same stocks as the benchmark index but weight them in the portfolio by factors such as momentum, value or low volatility. These factors are associated by some investors with superior returns. In contrast to market-cap-weighted indexes, smart beta portfolios are less reliant on a small number of large stocks and offer a more balanced exposure across the market. While they don’t overweight large stocks, and therefore may not outperform in a technology rally, they can provide returns that are less volatile than the benchmark and reduce the risk of exposure to overvalued stocks. Figure 4 illustrates the total returns on the ProShares S&P 500 Dividend Aristocrats ETF (NOBL)—discussed in my March 2021 article, “Viewing the Sector Exposure of Dividend Stocks Through the Aristocrats”—the Invesco S&P 500 Low Volatility ETF (SPLV) and the SPDR Portfolio S&P 500 High Dividend ETF (SPYD) relative to the SPDR S&P 500 ETF.
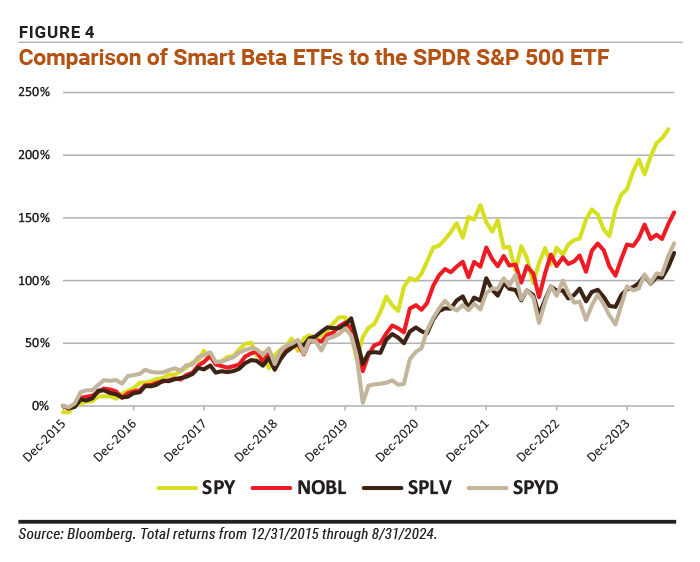
As the chart shows, the smart beta funds, although providing lower returns than the SPDR S&P 500 ETF, have done so with significantly less volatility. These funds may prove of interest to investors who wish to maintain exposure to the broad market but avoid the risks associated with market-cap weighting.
The shift to allowing nondiversification status by index funds, although reducing tracking error (deviation from benchmark returns), maintains an investor’s exposure to concentration risk. If you are comfortable with continued and potentially increasing exposure to a few large stocks, nondiversified ETFs may still align with your investment objectives. However, if you’re concerned about concentration risk or high valuations, you may want to reconsider your strategy. Remember that market-cap-weighted indexes tend to perform well in bull markets, particularly those led by technology stocks, while equal-weighted funds and smart beta strategies may outperform in a market downturn.
Investors are encouraged to periodically review their portfolios, and the underlying exposures of any funds they own, and consider if incorporating a smart beta (factor) or equal-weight strategy makes sense.
Portfolio Strategies

Portfolio Strategies


BARRY J from TX posted almost 2 years ago:
THOMAS S from OR posted almost 2 years ago:
ROBERT A from NC posted almost 2 years ago:
JIM L from MI posted almost 2 years ago:
BARRY J from TX posted almost 2 years ago:
You need to log in as a registered AAII user before commenting.
Log InCreate an account