

Don't Judge a Stock by Its High or Low Share Price
by Charles Rotblut | December 04, 2025
Featured Tickers: AAPL
AZO
BKNG
BLK
CMG
FICO
GOOGL
KLAC
LLY
MA
MTD
NFLX
NVR
SBUX
TDG
AAPL
AZO
BKNG
BLK
CMG
FICO
GOOGL
KLAC
LLY
MA
MTD
NFLX
NVR
SBUX
TDG
The group of S&P 500 index stocks with share prices above $1,000 has lost a member. Netflix Inc.  (NFLX) recently split its stock 10-to-1, which brought the share price down to $107.57 per share at the end of November.
Nine members of the S&P 500 continue to trade above $1,000 per share (based on end-of-November prices). They are NVR Inc. (NVR), Booking Holdings Inc. (BKNG), AutoZone Inc. (AZO), Fair Isaac Corp. (FICO), Mettler-Toledo International Inc. (MTD), TransDigm Group Inc. (TDG), KLA Corp. (KLAC), Eli Lilly & Co. (LLY) and BlackRock Inc. (BLK). The first three stocks, with the highest share prices, are in the consumer discretionary sector. Only Fair Isaac and KLA Corp. belong to the information technology sector.
Three ongoing trends have contributed to the existence of a $1,000+ share price club among the S&P 500 companies. One is the very large gains realized by the S&P 500 since the global financial crisis (2007–2009). Another is the small number of companies that split their stock each year. We are well into the second decade of relatively few stock splits. The third coinciding trend is a greater acceptance of higher-priced stocks. Commission-free trading and fractional trading have only added to this acceptance.
In writing this week’s commentary, I revisited an Investor Update column I wrote in 2012. At that time, the average share price of an S&P 500 stock was $58.52. (The average price is now $228.40.) The highest-priced stock in the large-cap index back then was Priceline.com, which traded at $632.00 per share. Now, NVR Inc. leads the S&P 500 with a share price of $7,521.84.
Notably, Priceline, which was rebranded as Booking Holdings in 2018, is one of only two stocks from the 2012 list that still rank among the top 10 S&P 500 companies by share price. Booking Holdings now trades at $4,914.69 per share. AutoZone is the other stock. Its share price has risen from $372.45 in 2012 to $3,954.33 now. AutoZone last split its stock in 1994. Booking Holdings has not split its stock since conducting a reverse split in 2003 following the dot-com crash. Reverse splits reduce the number of shares to increase the share price.
Several other stocks on the 2012 list have since split their shares. Alphabet Inc. (GOOGL), Apple Inc. (AAPL), Chipotle Mexican Grill Inc. (CMG) and Mastercard Inc. (MA) have all split their high-priced stocks within the past five years.
Stock splits can help individual investors by making it easier to diversify. While fractional trading does allow you to allocate among several stocks, not all brokers offer this option.
What low or high prices don’t do is tell you much about valuation. Fundamental factors such as earnings or yield are required to determine if a stock is cheap, reasonably valued or expensive.
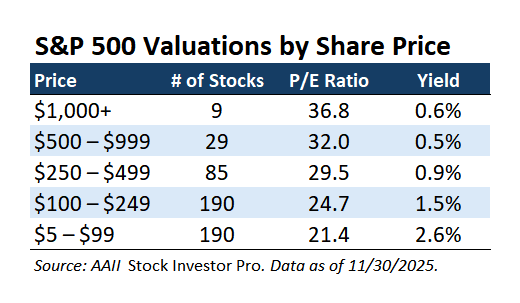
When we separate the S&P 500 member companies into share price buckets, we do see the impact of investor enthusiasm on valuations. Stocks whose share prices are at least $1,000 or between $500 and $999 have median price-earnings (P/E) ratios above 30.0. Stocks whose share prices are below $100 have a median price-earnings ratio of 21.4.
There are exceptions. NVR Inc.’s price-earnings ratio is just 16.5. Starbucks Corp. (SBUX), whose share price is $87.09, has a price-earnings ratio of 53.4. These two stocks exemplify why you should look beyond share price to determine whether a stock is pricey or a bargain. So, while the price of a single share of Netflix is now closer to $100 than $1,000, its price-earnings ratio remains high at 45.0.

-
To Stock Split or Not to Stock Split
Stock splits help to make shares more affordable to smaller investors and provide greater marketability and liquidity in the market. -
Incorporating the Price-Earnings Ratio Into Your Screening and Analysis
The price-earnings ratio is widely used as a valuation metric because of its simplicity. It embodies the market’s expectation of future company performance and relates it to actual, recent company performance. -
AAII 2025–2026 Tax Guide: Tax Rules for Your Personal Investments
Online exclusive: This supplement to our recently released annual tax guide explains the tax rules regarding the buying and selling of securities.
AAII Sentiment Survey
Optimism among individual investors about the short-term outlook for stocks increased in the latest AAII Sentiment Survey. Meanwhile, neutral sentiment and pessimism decreased.
Bullish sentiment, expectations that stock prices will rise over the next six months, increased 12.3 percentage points to 44.3%. Bullish sentiment is above its historical average of 37.5% for the first time in four weeks.
Neutral sentiment, expectations that stock prices will stay essentially unchanged over the next six months, decreased 0.4 percentage points to 24.9%. Neutral sentiment is below its historical average of 31.5% for the 72nd time in 74 weeks.
Bearish sentiment, expectations that stock prices will fall over the next six months, decreased 11.9 percentage points to 30.8%. Bearish sentiment is below its historical average of 31.0% for the first time in 45 weeks.
The bull-bear spread (bullish minus bearish sentiment) increased 24.2 percentage points to 13.5%. The bull-bear spread is above its historical average of 6.5% for the fifth time in 44 weeks.
This week’s special question asked AAII members what their favorite thing to eat on Thanksgiving is.
Here is how they responded:
- Turkey: 36.4%
- Pie/dessert: 22.9%
- Stuffing: 20.0%
- Gravy or cranberry sauce: 7.9%
- Other: 11.8%
Bullish: 44.3%, up 12.3 points
Neutral: 24.9%, down 0.4 points
Bearish: 30.8%, down 11.9 points
Bullish: 37.5%
Neutral: 31.5%
Bearish: 31.0%
See more Sentiment Survey results.

AAII Asset Allocation Survey
Individual investors’ allocations to bonds decreased while stock and cash allocations increased in the November AAII Asset Allocation Survey.
Stock and stock fund allocations increased 0.7 percentage points to 71.2%. Stock and stock fund allocations are above their historical average of 61.5% for the 66th consecutive month.
Bond and bond fund allocations decreased 0.8 percentage points to 14.0%. Bond and bond fund allocations are below their historical average of 16.0% for the fourth time in eight months.
Cash allocations increased 0.1 percentage points to 14.8%. Cash allocations are below their historical average of 22.5% for the 36th consecutive month.
- Stocks and Stock Funds: 71.2%, up 0.7 percentage points
- Bonds and Bond Funds: 14.0%, down 0.8 percentage points
- Cash: 14.8%, up 0.2 percentage points
- Stocks: 32.1%, up 1.7 percentage points
- Stocks Funds: 39.1%, down 1.0 percentage points
- Bonds: 4.7%, up 0.4 percentage points
- Bond Funds: 9.3%, down 1.2 percentage points
- Stocks/Stock Funds: 61.5%
- Bonds/Bond Funds: 16.0%
- Cash: 22.5%
Take the Asset Allocation Survey.
November 27, 2025 Important Family Conversations for Thanksgiving Weekend
November 20, 2025 November Charts of Interest: The S&P 500 Tends to Finish Strong
November 13, 2025 I Rebalanced for the First Time Since 2021
November 6, 2025 Single-Stock ETFs Underperform the Stocks They Track

Discussion
John from Massachusetts posted 9 months ago:
My wife and I are now around 80. We are starting to throttle back on stocks from 80% to 70% and maybe to 60%
Barry from TX posted 9 months ago:
So, Charles, I had all this time available since I could not pester the AAII Staff, so I decided to do some research. I wondered how asset allocations from the Thanksgiving week AAII Member Asset Allocation survey align with AAII Member preferences for Thanksgiving dinner courses, as indicated in a contemporaneous survey. I hypothesized that AAII member portfolio allocations predict AAII Member Thanksgiving meal course preferences. I used relative percentage allocations for both the asset classes and meal courses as proxies and for percentages as “P values” for “degrees of freedom.” My burning research question was, how well do AAII members' asset preferences align with Thanksgiving meal preferences? Drumstick roll, please!!! The data indicate that stocks (71.2%/HA 61.5%) align with turkey meat (36.4%); bonds/FI assets (14.0%/22.5%) align with stuffing (20.0%); cash (14.8%) aligns with gravy (7.9%); dividends (no data) are likely a good proxy for Pie/Dessert (22.9%); and “other” assets (11.8%) are an excellent proxy for the Blessings that AAII Membership offerings brought to each Member’s Family “table” this year. Now that Thanksgiving is over, I think I’ll plan a surprise for Christmas/Hanukkah/Kwanza. I am considering a similar “prediction market” simulation for how well AAII Member Sentiment Survey Indicator ratings predict prospects for world peace. OK, fellow members, Santa and the whole world will be watching. Get those bullish sentiments going to save the world ... and our portfolios. Cheers.
Barry from TX posted 9 months ago:
Charles, there is so much information about AAII diversity in the responses to this week’s special question -- what is your favorite thing to eat on Thanksgiving?" ... where 11.8% responded "other." Can you publish some of the "other" responses? I was one of the "immortal" 11.8%. I voted for black-eyed peas. It is a tradition at our family Thanksgiving dinner to serve black-eyed peas, a traditional southern "delicacy." They were served frequently during the Great Depression period because any sharecropper could grow them around their "shotgun" house and spice them up to taste with turnip greens and pork. After we survived the Depression and WWII, a tradition evolved to serve the peas when younger generations asked why we served them. The current protocol is for the most senior member to ask, "I wonder what the poor people are eating today?" The traditional answer is "black-eyed peas" to remind new generations at the table that we were not always as prosperous as we are now, and to be thankful for the feast before us -- tasty turkey, cornbread stuffing, green beans, dumplings, various special orders to accommodate tastes, and desserts we have before us. Then we say Grace and have fellowship. I bet there are dozens of similar traditions worth sharing. Can you publish a list?
Charles M Rotblut from Illinois posted 9 months ago:
Happy holidays, Barry!
The Sentiment Survey special question answers are all multiple choice. So, we don't have a list showing what was included in "other". It could have been sweet potatoes, rolls, a casserole or, if someone is a diehard Peanuts fan, popcorn and toast.
Barry from TX posted 9 months ago:
Thanks, Charles. Here is a comment related to the headline of this COI issue. Today, 12/08/25, WSJ published an article on the wide range of depreciation schedules AI leaders are using. This talks directly to AAII's fundamentals-based analysis teachings and this month's COI on not judging a stock by its price. In the WSJ article, the number of years AI management teams are choosing ranges from 3 to 7 years. Yes, the CEO and CFO choose depreciation schedules based on considerations. Some choose straight-line depreciation, others choose accelerated depreciation. Some choices are self-serving to "diddle" [guess] how soon they will need to have higher profits on some future earnings call to address analysts' valuation estimates of their earnings. The choice of an "estimated useful life" is a Rorschach test for a range of CEO characteristics, from data integrity to risk adversity. The WSJ article should have mapped the "estimated useful lives" on a book cost/years depreciation grid to help readers visualize the differences between AI management, so investors can match their risk tolerances to the company risk profiles. That would be "good" journalism.
You need to log in as a registered AAII user before commenting.
Create an account