


Related

AAII Sentiment Investing
The Advance/Decline line gives context to an index’s movement by looking at how many stocks are going up and how many are going down.

When investors hear that “the market” rose or fell, the statement usually refers to a major market index such as the S&P 500 index. Market indexes provide a convenient way to summarize the performance of hundreds or thousands of stocks. That convenience, however, comes with a trade-off: An index does not always reveal what is happening beneath the market’s surface.
For example, the S&P 500 is weighted by market capitalization. The largest companies in the index therefore have a much greater influence on its performance than the smaller constituents. A strong advance by a handful of mega-cap stocks can push the index higher, even when many other stocks are declining.
Market breadth provides another perspective. Instead of only asking whether the market went up or down, breadth analysis asks how many stocks participated in the move.
One of the oldest and most widely followed measures of market breadth is the Advance/Decline (A/D) line. Its calculation is simple, but the indicator can provide useful information about the strength of a market trend, whether participation is expanding or contracting and whether the behavior of the average stock confirms what the major indexes are showing.
Market breadth describes the degree to which individual stocks are participating in a market advance or decline. Suppose the S&P 500 rises 1% on a particular day. One possibility is that 400 of its stocks advanced while 100 declined. Such a move would represent broad participation.
Another possibility is that only 150 stocks advanced while 350 declined, but large gains among several of the index’s biggest stocks were sufficient to pull the cap-weighted index higher.
The S&P 500 could rise 1% in either situation, but breadth reveals that the underlying participation is quite different.
This perspective is particularly useful when market leadership becomes concentrated. A 5% move in a company with a market cap measured in trillions of dollars—such as Apple Inc.  (AAPL) or Nvidia Corp. (NVDA)—has far more influence on the S&P 500 than the same percentage move in one of the index’s smaller companies, which currently have market caps in the $6 billion to $10 billion range.
Therefore, breadth provides a way of asking what the broader population of stocks is doing rather than simply what the cap-weighted index is doing.
Market technicians generally view broad participation as confirmation of a market trend.
During a healthy market advance, investors ideally like to see a large number of stocks moving higher. Conversely, major indexes can continue rising even as participation narrows. Deteriorating breadth does not mean that a decline is imminent, but it does show that the character of the advance is changing.
This principle also works in reverse. During a market decline, an index may continue falling while fewer stocks make new lows or the number of advancing stocks begins to increase. Improving breadth can therefore provide evidence that selling pressure is becoming less widespread even before the major indexes visibly turn higher.
A useful way to think about market breadth is through three related dimensions: participation, trend and momentum.
Different breadth indicators answer different parts of these questions.
There is no single measure of market breadth. Common approaches include:
The A/D line has endured as one of the most popular breadth indicators, partly because its construction and interpretation are straightforward.
The A/D line begins with two pieces of information: the number of stocks that advanced during a trading session and the number that declined. Stocks that were unchanged are generally excluded from the calculation. The analysis typically examines the stocks trading on the New York Stock Exchange (NYSE). Daily net advancers are calculated as:
Net Advancers = Advancing Issues – Declining Issues
Suppose 1,200 stocks trading on the NYSE advance while 800 decline. Net advancers is +400 (1,200 – 800).
If 700 stocks advance the following day while 1,300 decline, net advancers would equal –600.
The A/D ratio provides another way of expressing the same day’s activity:
A/D Ratio = Advancing Issues ÷ Declining Issues
In the first example, the ratio of 1,200 advancing issues to 800 declining issues would be 1.50. In other words, three stocks advanced for every two that declined. A ratio greater than 1.00 means that advancers outnumbered decliners, while a ratio below 1.00 means that decliners predominated.
Daily figures can be informative, but they are also noisy. The traditional A/D line solves part of this problem by accumulating daily net advancers:
Today’s A/D Line = Yesterday’s A/D Line + Today’s Net Advancers
If the A/D line began at zero, the +400 reading from the first day would raise it to +400. The following day’s –600 reading would lower it to –200.
The actual numerical value of the line is not particularly important because it depends on where the calculation began. What matters is its direction, trend and relationship to the market indexes (Figure 1).
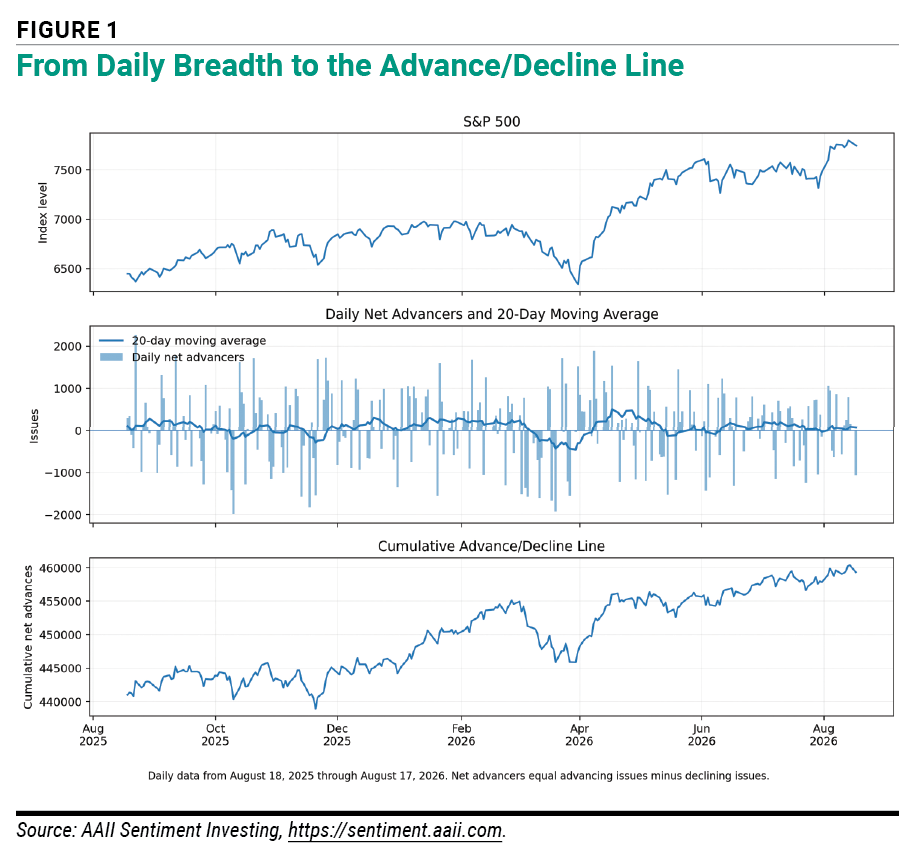
Daily advance and decline figures can fluctuate dramatically. One way to reduce this noise is to calculate a moving average of net advancers.
For example, a 20-day moving average measures the average daily difference between advancing and declining stocks over approximately one trading month.
If the average is positive, advancing stocks have generally outnumbered declining stocks during the period. A negative reading means that declining stocks have predominated.
Changes in the moving average can also provide information about breadth momentum. A rising average means that participation is improving relative to recent history, while a falling average means that it is deteriorating.
This illustrates an important distinction between the cumulative A/D line and shorter-term breadth measures: The A/D line describes the longer-term trend in participation, while daily net advancers describe what happened during an individual session. Moving averages, as well as breadth oscillators, can help determine whether the underlying participation trend is gaining or losing momentum.
These measures can occasionally tell different stories, which is often when breadth analysis becomes most interesting.
The simplest use of the A/D line is trend confirmation.
Suppose the S&P 500 is making a series of higher highs and higher lows. At the same time, the A/D line is also trending upward and reaching new highs. The two measures are telling a consistent story. The market index is advancing, and a broad group of stocks is participating.
This does not mean that the market cannot decline. Breadth is not a guarantee of future performance. Rather, the A/D line provides additional evidence supporting what investors see in the index.
More interesting situations develop when the market index and the A/D line stop moving together.
A divergence occurs when a market index and the A/D line move in different directions.
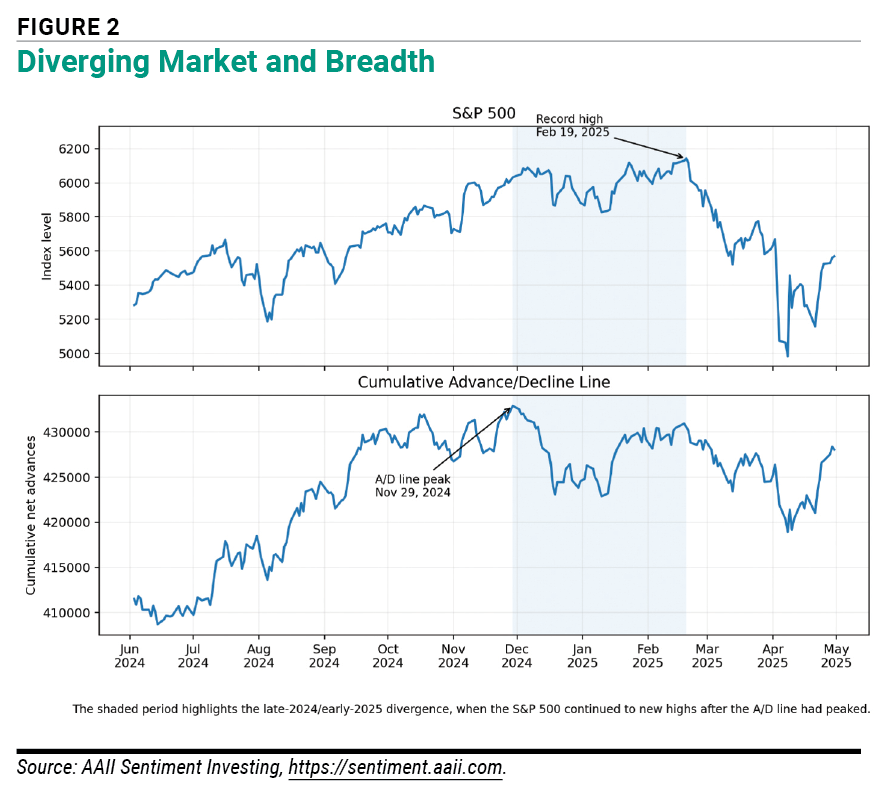
A bearish divergence develops when an index reaches a new high but the A/D line fails to reach a corresponding high. The implication is that the market’s advance has become narrower. The largest or strongest stocks may still be rising, but fewer stocks are participating.
A bullish divergence develops in the opposite situation. An index falls to a new low while the A/D line remains above its previous low or begins moving higher. Fewer individual stocks are participating in the decline, even though the index itself remains weak.
Such divergences attract attention because breadth can sometimes change direction before the major market indexes. The key word is sometimes.
A divergence should be viewed as a warning about changing market participation rather than a precise timing signal. An index can continue advancing for weeks or months after breadth begins deteriorating. Breadth can also recover, eliminating a bearish divergence without a major market decline occurring.
Likewise, improving breadth during a bear market does not guarantee that the market has reached its final low.
Therefore, the duration and magnitude of a divergence matter. A discrepancy lasting one or two trading sessions is far less meaningful than one developing over several weeks or months (Figure 2).
Traditional net advancers have one shortcoming: The number of securities trading can change over time.
Suppose there are 500 more advancing than declining issues during two sessions. If 1,500 issues participated in one session and 4,000 participated in the other, the same +500 reading represents different levels of breadth. One way to account for this is to express net advancers relative to participating issues:
Ratio-Adjusted Net Advancers (RANA) = Net Advancers ÷ (Advancing Issues + Declining Issues)
For example, if 1,800 stocks advance and 1,200 decline, net advancers equal +600. Dividing 600 by the 3,000 participating issues produces 0.20. In other words, 60% of participating issues advanced and 40% declined, a 20-percentage-point difference. Normalizing breadth this way makes different periods more comparable.
Investors should pay attention to the universe of securities used to construct an A/D line.
The traditional NYSE A/D line is based on securities traded on the New York Stock Exchange. However, depending on the data source, exchange-wide statistics may include securities other than stocks. As such, some analysts prefer a common-stock-only A/D line or one constructed from the constituents of a particular index, such as the S&P 500.
Nasdaq breadth can behave differently because of differences in the composition of listed securities and the large number of smaller companies traded on the exchange. The most important consideration is consistency. Investors should understand which securities are included and compare the same breadth series over time.
The equal weighting of advancing and declining issues is both one of the A/D line’s greatest strengths and an important limitation.
Every issue receives one vote. An advance by one of the country’s largest companies counts exactly the same as an advance by a much smaller company. This prevents mega-cap stocks from dominating the indicator, which is precisely why the A/D line can reveal information that cap-weighted indexes miss.
At the same time, there are many more small- and mid-cap stocks than there are mega-cap stocks. Consequently, A/D statistics can be heavily influenced by smaller companies. Thus, a falling A/D line does not mean that the S&P 500 must be declining. It may instead reflect relative weakness among smaller stocks while large-cap stocks remain strong.
Perhaps the biggest mistake investors can make with breadth indicators is expecting them to identify market tops and bottoms precisely.
Markets do not have to reverse simply because breadth deteriorates. Narrow markets can become narrower, and strong stocks can continue advancing long after other stocks have weakened. The reverse is also true. Improving breadth during a market decline can occur well before the market reaches its ultimate low.
For this reason, breadth is generally more useful as a confirmation and risk-assessment tool than as a stand-alone market-timing system.
Market indexes are indispensable tools, but they compress the performance of hundreds or thousands of securities into a single number. Inevitably, information is lost. Market breadth puts some of that information back.
The A/D line asks an exceptionally simple question: Are more stocks going up or going down? Accumulating those daily answers produces a picture of participation over time. When the A/D line rises along with the market, breadth confirms that an advance is widely shared. When the two diverge, investors have reason to investigate what is changing beneath the surface.
The A/D line will not predict every correction or identify the beginning of every rally. Its value is providing information that a market index alone cannot: whether the broader population of stocks is participating in the market’s movement.
AAII’s Sentiment Investing Dashboard can help you interpret and apply sentiment indicators. It includes 13+ indicators measuring investor sentiment and market sentiment, breadth, valuation, trend and volatility. The A/D line is tracked with other market breadth indicators. Find out more at the AAII Sentiment Investing site.
AAII Sentiment Investing

AAII Sentiment Investing

AAII Sentiment Investing

JOHN L from NJ posted about 1 month ago:
ROBERT A from NC posted about 1 month ago:
BARRY J from TX posted 18 days ago:
ROBERT A from NC posted 16 days ago:
You need to log in as a registered AAII user before commenting.
Log InCreate an account