

Pessimism Was High in 2020, but Investors Stayed With Stocks
by Charles Rotblut | January 21, 2021
Last year, the average level of pessimism in our weekly AAII Sentiment Survey was the fourth highest it has ever been. The percentage of individual investors describing their six-month outlook for the stock market as “bearish” averaged 38.8% in 2020.
This was the highest average level of pessimism for a full calendar year since 2009, when bearish sentiment averaged 41.9%. The other two years with higher average levels of pessimism in the AAII Sentiment Survey were 1990 (40.3%) and 2008 (45.2%).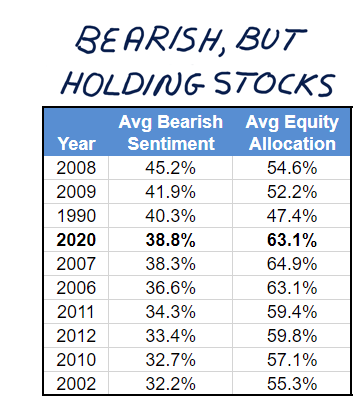
Bearish sentiment was at an unusually high level during 27 out of last year’s 53 weekly survey periods. An unusually high reading is one that is above the typical level. (We define such readings as being more than one standard deviation above the historical average.) The reason was the coronavirus pandemic. Bearish sentiment spiked to 51% in early March 2020 and largely stayed above 40% until September. It took the news about the coronavirus vaccines being successful to finally push pessimism down below its long-term historical average of 30.5%.
We’ve long said that there is a difference between individual investors’ expectations for how the market will perform and what they do with their portfolios. Data from our monthly AAII Asset Allocation Survey supports this. During 2020, AAII members allocated an average of 63.1% of their portfolios to stocks and stock funds [mutual funds, exchange-traded funds (ETFs), etc.]. This is very close to the median equity allocation for a calendar year since 1990. As the table on the right shows, AAII members have often kept more than half of their portfolios in stocks even when their collective pessimism about the short-term direction of the S&P 500 index has been comparatively high.
This is not paradoxical. Disciplined investors prevent their short-term outlooks from interfering with their long-term strategies.
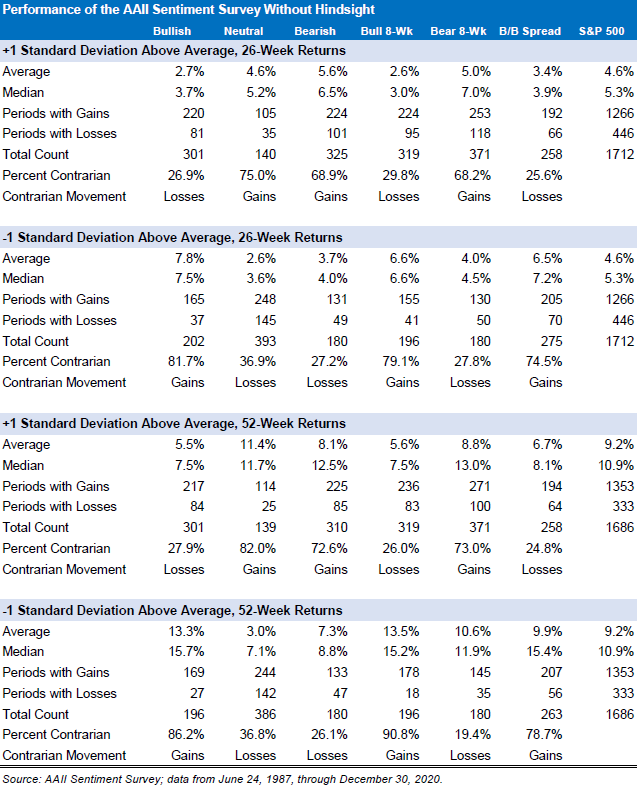
There is an old adage suggesting that investors should buy when pessimism is high. The data from our sentiment survey is mixed in terms of support. Since 1987, the S&P 500 has realized a six-month average gain of 5.6% and a median gain of 6.5% following unusually high bearish sentiment readings. This compares to average and median gains of 4.6% and 5.3% for all survey periods. On a 12-month basis, the average S&P 500 return of 8.1% following unusually high levels of pessimism is below the average of 9.2% for all periods. The median 12-month gain of 12.5% following unusually high levels of pessimism is above the median of 10.9% for all periods. (Many of the instances where the S&P 500 realized negative 12-month returns following unusually high bearish sentiment readings occurred between 2000 and 2002.)
The data from the AAII Sentiment Survey shows a stronger link between unusually low levels of optimism and higher returns. In other words, consider buying when others are discouraged from doing so. The average and median six-month returns for the S&P 500 following unusually low bullish sentiment readings are 7.8% and 7.5%. For 12-month periods, the average and median returns are 13.3% and 15.7%. Optimism was at an unusually low level 13 times last year.
While the links between unusually low and unusually high levels of bullish and bearish sentiment and market performance are not causal, such readings can be a sign to consider the broader market and economic mosaic. Ask what is occurring that would give individual investors reason to feel unusually cautious or pessimistic. The answer may reveal whether it makes sense to check your allocation to see if it is still approximately in line with your goals, if any presently held investments are meeting your sell rules or if it is time to see if there are investments that have been put on sale because of prevailing market conditions.

- I discussed how we determine what an unusually high or low sentiment reading is, and our rationale for doing so, in this 2014 AAII Journal article. The data is older, but the explanations remain valid.
- In this 2004 article, Mark Hulbert considered the history of sentiment indicators and made observations on their usefulness.
- If you’re looking for ideas about where to invest in the current market environment, our stock screens can help. Derek Hageman explains which ones have realized the best returns.
- Wayne Thorp provides more information about how to pick a stock screen.
- Julie Jason will explain how to lay a foundation for making investment decisions in uncertain markets in a webinar scheduled for this Wednesday at 7:30 p.m.
AAII Sentiment Survey
Pessimism among individual investors about the short-term direction of the stock market rose to its highest level in 11 weeks. Optimism, though lower than the last reading, remained above average.
Bullish sentiment, expectations that stock prices will rise over the next six months, declined 2.6 percentage points to 42.5%. Optimism is above its historical average of 38.0% for the 10th consecutive week.
Neutral sentiment, expectations that stock prices will stay essentially unchanged over the next six months, declined 0.1 percentage points to 23.0%. Neutral sentiment remains below its historical average of 31.5% for the 50th time out of the past 53 weeks.
Bearish sentiment, expectations that stock prices will fall over the next six months, rose 2.7 percentage points to 34.5%. Pessimism was last higher on October 28, 2020 (35.3%). Pessimism is above its historical average of 30.5% for the second time this year.
Bullish sentiment is within its typical range. However, it remains above 40% for the 10th reading week. This is the longest consecutive streak of such readings since an eight-week stretch between December 14, 2017, and January 31, 2018.
The rollout of the coronavirus vaccines has helped to improve the outlook of many individual investors. The stock market’s momentum is also having an influence on sentiment. Concern about the shorter-term trends in coronavirus cases and the resulting economic impact remain, however. Also playing a role are the new presidential administration and the Democrats’ control of the Senate, the rising level of national debt, valuations and interest rates.
Due to a software error, the results for the survey period ending on January 13, 2021, could not be tabulated. The data for the previous week was adjusted to reflect results from the period of December 31 through January 4. The changes in bullish, neutral and bearish sentiment reflect the difference between this week’s reading and the reading recorded for the survey period ended on January 4.
This week’s special question asked AAII members to share their thoughts about the rise in bitcoin’s price over the past six months.
Slightly more than two out of five respondents (41%) say that they think the rise in bitcoin is unsustainable and that the cryptocurrency will likely crash in the near future. Many within this group compare the rise in bitcoin to the Dutch tulip bulb mania. About 17% of respondents think bitcoin will continue to rise. About 15% of respondents say that they think bitcoin is very risky. In addition, about 16% of respondents say that they do not understand the concept behind bitcoin.
Here is a sampling of the responses:
- “As long as people believe in it, it will go up very high. If their belief is shaken, then it will crash like it was a bubble.”
- “Foolish, I have been buying tulips instead.”
- “Irrational exuberance. While bitcoin can be somewhat compared to owning gold, it is a fabricated store of wealth and as such really has nothing behind it to justify its valuation.”
- “Excess money printed by the Federal Reserve and stimulus by Congress needs to go somewhere. Bitcoin shares are limited in number and there is the classic fear of missing out (FOMO) surge in buying. The rally in bitcoin could be killed by a word or two from the U.S. Treasury or another part of government like the IRS. I won’t be buying any bitcoin although I could benefit if any part of it is real by ownership in PayPal Holdings Inc. (PYPL).”
Bullish: 42.5%, down 2.6 points
Neutral: 23.0%, down 0.1 points
Bearish: 34.5%, up 2.7 points
Bullish: 38.5%
Neutral: 30.5%
Bearish: 31.0%
See more Sentiment Survey results.

January 14, 2021 How Much Are Mega Millions and Powerball Lottery Tickets Worth?
January 7, 2021 11 More Financial and Investing Resolutions for 2021
December 31, 2020 Financial and Investing Resolutions for 2021, Part 1
December 24, 2020 New Stimulus and Extended Tax Breaks

Discussion
Barry J from TX posted over 5 years ago:
This modest article reinforces the AAII investment mantra that "Disciplined investors prevent their short-term outlooks from interfering with their long-term strategies." It also offers a trove of data points (in the big table) on the variability of sentiment +/- 34% around the mean over short-term periods. However, this same data could be used to construct trends and patterns of leading indicators of market "momentum.” Since 1759, we have known that ("moral") sentiments are the collective force behind the "invisible hand" that drives market directions (and variability). I would prefer to see analyses using Bayesian updates on the "posterior probabilities" that can be used to derive updated percentages on the impact of the “post” data in the latest surveys. Analyzing monthly updated "sentiment" data would surface changing probabilities that point to early, leading trends. This data would counterbalance AAII Superstar Stock Report "prior" data that is only backward looking. SSR data is updated using backward-looking, non-Bayesian rules. Since around 1812 we have known that analysis of data is all about probabilities. Since AAII owns this survey data, using it to compute updated Bayesian probabilities is AAII’s “sustainable competitive advantage” (or “moat”). Comments?
Steve H from IN posted over 5 years ago:
Looking at that table, I wonder how much of the low stock allocations in 1990, 2008, 2009, etc. was due to the reduced value of their holdings after a bear market rather than a conscious decision to reduce exposure to stocks.
You need to log in as a registered AAII user before commenting.
Create an account