

The Advantages of Stock Screening
by Charles Rotblut | September 02, 2021
I believe stock screeners and stock screens should be used routinely by investors who seek to buy individual stocks. Doing so is a better way to invest.
I’ll share my logic in a moment, but first I want to explain why I am specifically bringing this topic up this week: We just launched our A+ Investor Custom Stock Screener. This is a brand new online screening tool. It is platform independent, meaning it can be accessed from a PC, a Mac, an iPad, an Android tablet … pretty much any device with a web browser. The Custom Stock Screener is part of our A+ Investor service. If you haven’t tried A+ Investor, now is a good time as we are running a special Labor Day promotion. 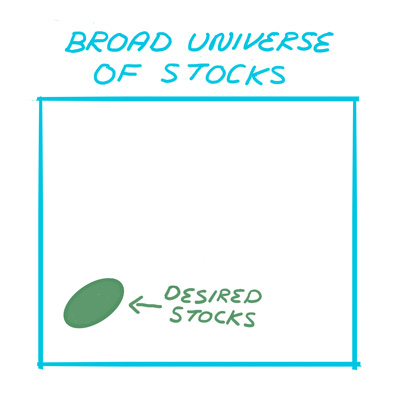
Stock screeners allow you to choose which criteria to seek out. You could build a screen seeking dividend stocks with above-market yields (e.g., yields of at least 2%), double-digit sales growth and double-digit return on equity (ROE) for instance. (There are 55 exchange-listed stocks with these traits.) Stocks screens—including the 60+ stock screens available to AAII members—lack the ability to customize but still accomplish the same outcome: identifying stocks with specific traits.
Whether you use a stock screener or pre-built stock screens, you get the convenience of narrowing the universe of 5,500 exchange-listed stocks down to those with characteristics you prefer. This can be done by simply clicking a button.
Compare this to the alternatives. Reading magazines or blogs for investment ideas is a bit like walking into a Costco store to shop for barbeque-flavored chips. Maybe you’ll find what you’re looking for and maybe you won’t. Even if you do, the selection is going to be very limited. (Maybe they only have a gigantic bag of Lay’s when you really wanted small bags of Jays.) Tips from friends? They could be based on strategies completely different from what you use. And you’ll be reliant on your friend’s skills. Those skills might be better or, potentially, much worse than your friend would like you to believe. Analyst recommendations? They are limited in scope. Not to mention the questionable performance of buy recommendations.
Unlike humans, whose decisions are frequently influenced by irrelevant factors, stock screens are objective. Screens are essentially database filters. List the quantitative traits you want and the screen will find stocks with those traits. A stock either has the required characteristics or it doesn’t. There are no shades of gray.
More importantly, screens will lead you to stocks you would not have otherwise thought to consider. Some of these will be familiar names; others will not be. I’ve had screens identify stocks I’ve never heard of that have gone on to become big winners. Even when a company I have some familiarity with passes a screen I use, it may not be an investment candidate I previously had on my radar. The odds of me unearthing such portfolio gems would have been very low had I not made use of screening tools.
No screen or stock screener can guarantee you great returns. What they can do is save you considerable time and identify potential investment candidates you would have otherwise missed.

- My colleague Wayne Thorp will show you how to use our new custom screener on Wednesday, September 8.
- For those of you looking for ideas on constructing a winning stock screen, this 2012 AAII Journal article by John Bajkowski offers helpful ideas.
- The September AAII Journal is now online! In it, Derek Hageman shares the real estate investment trusts (REITs) passing a growth-oriented screen he created.
The U.S. financial markets, and our offices, will be closed on Monday in observance of Labor Day. L’shana tova to those of you observing Rosh Hashanah next week.
AAII Sentiment Survey
Optimism among individual investors about the short-term direction of the stock market rose to a two-month high. In addition, the percentage of individual investors describing their outlook for stocks as “neutral” continued to fall.
Bullish sentiment, expectations that stock prices will rise over the next six months, increased by 3.9 percentage points to 43.4%. Optimism was last higher on July 1, 2021 (48.6%). This is the second time in the last eight weeks that optimism is above the historical average of 38.0%.
Neutral sentiment, expectations that stock prices will stay essentially unchanged over the next six months, fell by 4.2 percentage points to 23.2%. Neutral sentiment was last lower on April 15, 2021 (21.5%). The historical average is 31.5%.
Bearish sentiment, expectations that stock prices will fall over the next six months, rose by 0.4 percentage points to 33.3%. This is the fifth consecutive week that pessimism is above its historical average of 30.5%.
Neutral sentiment is almost at the bottom of its typical historical range. Optimism and pessimism are within their typical historical ranges.
The return to normalcy from the coronavirus pandemic, monetary and fiscal stimulus and inflationary pressures are influencing individual investors’ outlook for stocks. Other factors include earnings, valuations and the Biden administration’s initiatives.
In this week’s special question, we asked AAII members to share their thoughts about second-quarter earnings.
Close to half of respondents (44%) are encouraged by the earnings reports, seeing it as a sign of better things to come amid market uncertainty. This compares to 21% of respondents who say they feel more cautious or uncertain of the results. Many of these respondents note that comparing this year’s results to the second quarter of 2020 isn’t fair, since the year-ago period was the height of the coronavirus pandemic. Respondents in this category say more data and time are needed to make a more solid conclusion. About 17% of responses convey negative sentiment about the results, citing inflation as a reason why some earnings were especially high. In addition, 8% of respondents express that second-quarter earnings simply met their expectations. Finally, 6% of respondents are neutral about this quarter’s earnings results since they are long-term investors.
Here is a sampling of the responses:
- “They look good and probably will get better as the economy improves, especially if the delta variant is brought under control.”
- “Comparisons to second-quarter 2020 were meaningless, but against 2019 they were very good. I think job turnover was a big factor, which suggests future higher cost and inflation.”
- “Companies should generally be able to meet/beat these numbers but the third quarter and fourth quarter will be much more difficult and the market will go sideways/down into early 2022.”
- “As we continue to get out of the pandemic, more and more people return to normal activities, which allows consumption to reach higher levels. This is no surprise for me.”
- “I don’t care quarter to quarter. I’m long-term.”
Bullish: 43.4%, up 3.9 points
Neutral: 23.2%, down 4.2 points
Bearish: 33.3%, up 0.4 points
Bullish: 38.0%
Neutral: 31.5%
Bearish: 30.5%
See more Sentiment Survey results.

August 26, 2021 Put an Asterisk by Those Second-Quarter Results
August 19, 2021 Why Not Having to Trade Is a Big Advantage
August 12, 2021 The Key Pillars of Good Dividend Stocks
August 5, 2021 An Update on Inherited Retirement Accounts and Bankruptcy Protections

Discussion
No comments have been added yet. Add your thoughts to the discussion!
You need to log in as a registered AAII user before commenting.
Create an account