

Put an Asterisk by Those Second-Quarter Results
by Charles Rotblut | August 26, 2021
Second-quarter earnings season has been unusual. Consider these observations made last Friday by Refinitiv senior research analyst Tajinder Dhillon about the results reported by S&P 500 index companies (using I/B/E/S data from Refinitiv):
• The current 21Q2 earnings growth rate is the highest since 2009 Q4.
• 87.4% reported earnings above analyst expectations. This is the highest on record (since 1994).
• 87.0% reported revenues above analyst expectations. This is the highest on record (since 2002).
The positive surprises and strong growth are not limited to large-cap companies. We’re noticing similar trends in mid-cap and small-cap companies as well. Corporate revenues and earnings are bouncing back, and analysts have underestimated how good the year-over-year comparisons are.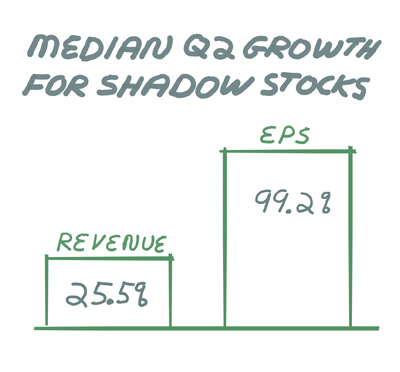
AAII president John Bajkowski addressed this phenomenon in his latest Model Shadow Stock Portfolio Update, which was published last week. I’m going to share his insights here because they provide color to the trends we’re seeing.
Year-Over-Year Comparisons Are Nothing Near Normal
Normally looking at year-over-year quarterly results as opposed to a sequential quarterly comparison helps to account for the typical seasonal swings that occur over the course of the year. A year-over-year comparison should help reveal the direction and strength of the company’s growth and the effectiveness of management.
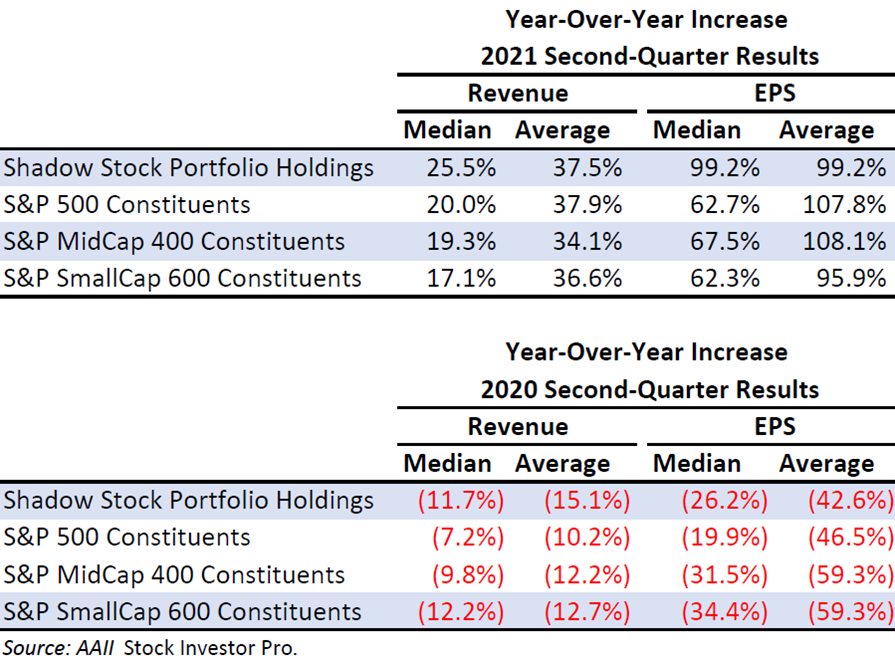
Of course, the last year and a half have been nothing near normal. The impact of the coronavirus pandemic was strongly felt in the second quarter of 2020. This year, as companies report second-quarter results, we are seeing extremely strong year-over-year comparisons. For the most recent quarter, the average year-over-year revenue growth is 37.5%, while the average year-over-year earnings per share increase is 99.2% for the stocks currently in the Model Shadow Stock Portfolio. The median (or midpoint) value that helps to alleviate the impact of extreme numbers observed with averages is very similar. The median year-over-year quarterly revenue growth is 25.5%, while the median earnings per share growth is still 99.2%.
For the same stocks currently in the Model Shadow Stock Portfolio, last year for the second quarter they were reporting a drop in revenue of 15.1% on average (11.7% median) year-over-year and a decrease in earnings per share of 42.6% on average (26.2% median) compared to the second quarter of 2019.
Similar results can be observed by most stocks. For example, the stocks in the S&P 500 index have averaged a 37.9% year-over-year gain in revenue for the most recently reported quarter this year compared to a decline of 10.2% year-over-year last year. As you may have noted, changes in earnings per share have been even more dramatic. With companies in the S&P 500 reporting an earnings gain of 107.8% average (62.7% median) year-over-year for the most recent quarter compared to a decline of 46.5% average (19.9% median) last year.
The coronavirus pandemic created a sudden and extreme decline in economic activity last year. As companies reported poor results, a number of Model Shadow Stock Portfolio holdings were placed on earnings probation. Other shadow stocks were suddenly showing losses under generally accepted accounting principles (GAAP) but also supplied adjusted earnings that were positive because nonrecurring events were excluded from the calculation. We are now seeing the Model Shadow Stock Portfolio holdings coming off earnings probation and notes are being removed regarding the disparity between adjusted earnings and GAAP earnings.
There are many factors influencing the economy and the market beyond the coronavirus, yet the virus continues to strongly influence economic behavior globally and, in turn, the stock market. The highly contagious delta variant is throwing a monkey wrench into the post-pandemic reopening plans of many institutions. Counties that were able to contain the spread of coronavirus with strict social distancing and quarantine mandates now find themselves dealing with strong outbreaks. It serves as a reminder that it is the unexpected events and news that make major impacts on the market, as millions of market participants suddenly change their opinion of likely future outcomes. As former U.S. Defense Secretary Donald Rumsfeld famously noted, it is the unknown unknowns that drive the biggest surprises when they are revealed. The unknown unknowns are the things that we are neither aware of nor understand yet will come to impact us: “There are known knowns; there are things we know we know. We also know there are known unknowns; that is to say we know there are some things we do not know. But there are also unknown unknowns—the ones we don’t know we don’t know.”

- Interested in seeing the latest Model Shadow Stock Portfolio updates as soon as they are published? Sign up for the Model Shadow Stock Portfolio email alerts.
- Earnings surprises and earnings estimate revisions can have a longer impact on a stock’s price than many realize.
- Though earnings announcements do contribute to the volatility in stock prices, maintaining a significant allocation to stocks can help you avoid financial peril in retirement.
- For those of you who prefer funds instead of individual stocks, closed-end funds can be worth consideration.
- Join us on Wednesday for our latest Individual Investor Show. We’ll discuss how to hit a home run in retirement, real estate investment trusts (REITs) and the Level3 Passive Portfolio.
AAII Sentiment Survey
Optimism among individual investors about the short-term direction of the stock market saw a substantial increase, accelerating above its historical average. Meanwhile, the percentage of investors describing their outlook for stocks as neutral fell below its average.
Bullish sentiment, expectations that stock prices will rise over the next six months, rose 6.4 percentage points to 39.6%. This is the first time that optimism is above the historical average of 38.0% in the last seven weeks.
Neutral sentiment, expectations that stock prices will stay essentially unchanged over the next six months, fell by 4.3 percentage points to 27.5%. This is the first time in eight weeks that neutral sentiment is below its historical average of 31.5%.
Bearish sentiment, expectations that stock prices will fall over the next six months, declined by 2.1 percentage points to 33.0%. This is the fourth consecutive week and the fifth time out of the last 29 weeks that bearish sentiment is above its historical average of 30.5%.
At current levels, all three readings are within their typical historical ranges.
The return to normalcy from the coronavirus pandemic, monetary and fiscal stimulus and inflationary pressures are influencing individual investors’ outlook for stocks. Other factors include earnings, valuations and the Biden administration’s initiatives.
In this week’s special question, we asked AAII members how inflation is impacting their investment decisions. More than half of respondents (54%) say that they have no current worry about inflation, or that they think the effects of inflation will be minimal. Many say that inflation talks are no cause to worry until there are actual indicators of inflation.
Fifteen percent state that they are investing more in stocks, with the thought that the market will continue to increase with inflation. Many of these respondents say that they are trying to move into stocks that can sustain in a high-inflation environment.
This compares to 12% of respondents who say they are reducing exposure in their portfolios in expectation of a market correction. Many say they are trying to move into gold or other materials that historically have held up against the depreciation of the U.S. dollar.
Another 9% of respondents convey a mixed outlook, stating that they are uncertain or are currently monitoring to see what will happen in the short term. Finally, about 6% say that they are trying to generate extra income by moving into stocks that have higher dividend yields. Some state that they are moving into Treasury inflation-protected securities (TIPS) in case the U.S. defaults on the bonds that they currently own.
Here is a sampling of the responses:
- “Even though I am not that positive on the market, I am staying pretty fully invested hoping that the market will outperform whatever inflation we have. The big question right now is the virus though.”
- “I believe inflation is higher temporarily, which will support higher stock valuations.”
- “I’m looking for firms that can take advantage of increasing inflation.”
- “The stock market is hitting new record highs. There is nowhere to go but back down. Don’t buy at the top.”
- “It is making me less interested in fixed-income assets, while looking to sectors that are going higher due to supply chain issues.”
Bullish: 39.6%, up 6.4 points
Neutral: 27.5%, down 4.3 points
Bearish: 33.0%, down 2.1 points
Bullish: 38.0%
Neutral: 31.5%
Bearish: 30.5%
See more Sentiment Survey results.

August 19, 2021 Why Not Having to Trade Is a Big Advantage
August 12, 2021 The Key Pillars of Good Dividend Stocks
August 5, 2021 An Update on Inherited Retirement Accounts and Bankruptcy Protections
July 29, 2021 Making Sense of Stock Splits

Discussion
Tom M from IL posted over 5 years ago:
As a long-term investor, I was interested in what the numbers in the table for 2020 and 2021, above, show the combined annual growth to be. Here's what I calculated for average revenue and EPS, respectively: Shadow Stock revenue 8.0% and EPS 6.9%; S&P 500 revenue 11.3% and EPS 5.4%; S&P 400 revenue 8.5% and EPS (8.0%); S&P 600 revenue 9.2% and EPS (10.7%). I prefer the average because, as an equal weight investor, my return is averaged over my investments; I don't earn the median return.
Barry J from TX posted over 5 years ago:
2Q20 market results were a statistical outlier. Some say a Black (maybe grey) Swan event. 2021 market comparisons are anomalies. It is difficult for me to believe that these fun-house mirror comparisons of 2021 market performance were NOT priced in by the several thousand analysts who track Mr. Market. Regression to the mean will take care of all this nonsense. The big event looming over all this "irrational exuberance" is how will the highly-leveraged investors (non AAII members) respond to having the Fed punch bowl removed. Cue Dandy Don.
You need to log in as a registered AAII user before commenting.
Create an account