

The Key Pillars of Good Dividend Stocks
by Charles Rotblut | August 12, 2021
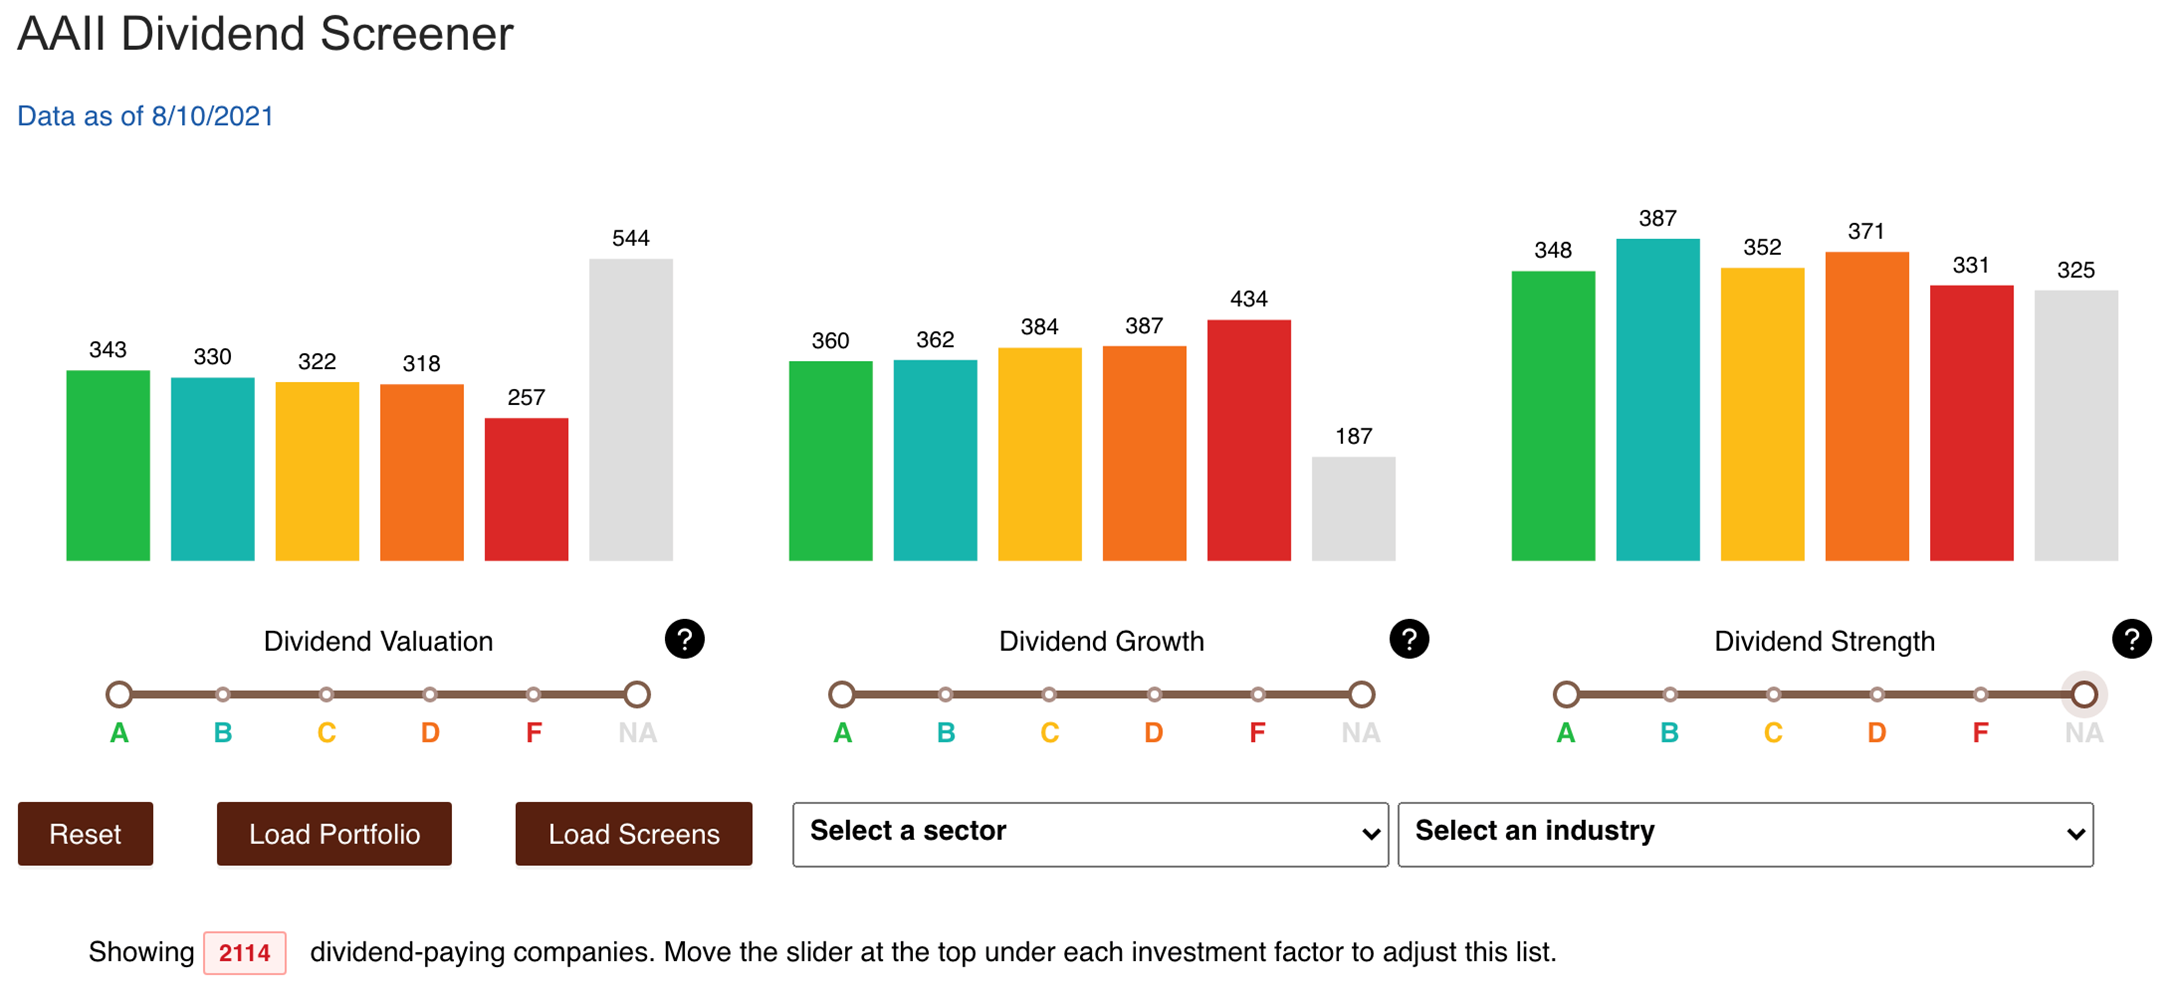
Last night, Derek Hageman unveiled our new AAII Dividend Screener. As the name implies, it is a screener specifically designed to seek out dividend-paying stocks. The screener is based on the three dividend pillars used for the AAII Dividend Investing (DI) portfolio: growth, valuation and strength. All three provide useful metrics for judging whether a dividend-paying stock is attractive or not, as Derek explains.
Pillar I: Growth Trends
There are several characteristics to consider when assessing the growth trends of dividend-paying stocks. A company’s record of growth in revenue and earnings should be analyzed. Profit margins, earnings surprises and estimates, dividend history and dividend growth trends also need to be looked at. These growth trends matter because a company’s success is driven by its ability to generate sales and convert the revenue into earnings and cash flow.
Strong sales growth is meaningless if management allows costs and expenses to grow disproportionately. Therefore, it is useful to analyze the profitability of a company by calculating and tracking various profit margin ratios—gross margin, operating margin and net margin. Net margin is the “bottom line” profit that is generated from all phases of the business, including interest and taxes. The net margin compares net income to sales.
Profit margins are expressed as percentage ratios to facilitate the comparison of a wide range of companies that vary in size. It is important to note that margins can differ from industry to industry, so it is vital to compare firms in similar lines of business. Profit margins provide a great window into company and industry trends, the competitive environment and management’s ability to manage costs.
Pillar II: Financial Strength
In order to determine the financial strength of a company, you need to understand its underlying financials and its ability to generate cash flow, pay its obligations and return capital to shareholders. A company’s leverage ratios, cash flows and payout ratios (earnings and cash flow) can provide useful insights.
One of the key characteristics important for dividend investors to look for in a company is free cash flow. Free cash flow is calculated by deducting capital expenditures (capex) from cash from operations. Free cash flow indicates whether a company is generating enough cash from its normal business operations to fund its capex and still have money available to pay a dividend, buy back shares or make acquisitions.
The safety of a company’s dividend can be evaluated by examining its free cash flow relative to its dividend—its free-cash-flow payout ratio. This ratio analyzes how much cash a company is paying in dividends as a percentage of free cash flow. Investors should look to the free-cash-flow payout ratio to understand if a company is generating enough cash to cover its dividends year to year. If it is not, the dividend payment may not be sustainable.
Pillar III: Valuation
Valuation is another key component in seeking attractive dividend-paying stocks. Stock prices tend to fluctuate between high and low extreme valuation levels, and these relationships can be used to determine a stock’s value range. Two valuation metrics used in DI are the dividend yield and the trailing price-earnings (P/E) ratio.
The primary valuation measure for DI is relative dividend yield (indicated annual dividend per share divided by price per share). The dividend yield can be used to calculate a valuation estimate, indicating if a stock is expensive relative to its historical norm. Dividend Investing seeks out undervalued dividend-paying stocks with current yields above their five-year historical average, yet that are expanding their dividend payments at a greater-than-average rate. Overvalued stocks are avoided when their current yield is below their five-year average.
The price-earnings ratio is another cornerstone measure of value. The price-earnings ratio is determined by dividing a stock’s price by its earnings per share reported over the most recent four quarters. It is important to see how trailing price-earnings ratios compare with historical averages. A price-earnings ratio lower than its historical average would be a potential sign that the stock is undervalued, and vice versa.
Number of Dividend Stocks by Pillars
The new AAII Dividend Screener allows DI subscribers to screen for stocks based on one, two or all three pillars. Grades are assigned to dividend stocks based on how their valuations, growth and strength compares to all other dividend stocks. Each grade represents a quintile. Grades of A reflect the best 20% and grades of F reflect the worst 20% for a given pillar. Just 12 stocks have A grades across all three pillars; 107 stocks have grades of A or B for each of the three pillars.

- Here’s a replay of Derek Hagemen showing how to use the three dividend investing pillars to find good dividend stocks.
- As noted, the payout ratio can tell you if the dividend payment is sustainable.
- Regardless of whether you favor dividend stocks or not, having guidelines for selecting stocks can help you, as I explain in the August AAII Journal.
- Another way to identify good stocks is to make use of factors. Alpha Architect’s Jack Vogel gives a look behind the curtain of factor investing.
- Tune in next week for our latest Individual Investor Show. We’ll be discussing closed-end funds, selecting stocks with AAII’s PRISM Wealth-Building Process and more.
AAII Sentiment Survey
Bullish sentiment increased modestly to its highest level in five weeks, according to the latest AAII Sentiment Survey. In addition, the number of investors describing their outlook for stocks as “neutral” decreased for the second consecutive week.
Bullish sentiment, expectations that stock prices will rise over the next six months, rose 0.9 percentage points to 37.0%. Despite the increase, this is the fifth consecutive week that optimism is below the historical average of 38.0%.
Neutral sentiment, expectations that stock prices will stay essentially unchanged over the next six months, fell 0.7 percentage points to 31.5%. This matches the historical average. Neutral sentiment has been at or above average for 15 out of the past 16 weeks.
Bearish sentiment, expectations that stock prices will fall over the next six months, declined by 0.2 percentage points to 31.5%. This is the second consecutive week and the third time out of the last 27 weeks that bearish sentiment is above the historical average of 30.5%
At current levels, all three readings are well within their typical historical ranges.
The return to normalcy from the coronavirus pandemic, inflationary pressures and monetary and fiscal stimulus are influencing individual investors’ outlook for stocks. Other factors include earnings, valuations and the Biden administration’s initiatives.
In this week’s special question, we asked AAII members to share their thoughts on how oil prices were impacting their outlook for stocks.
Almost three out five respondents (58%) say that oil prices are having no impact on their portfolios or their outlook on stocks. Many indicated that they are avoiding oil stocks due to the uncertainty related to them. This compares to 14% of respondents who say that they have a positive outlook, mentioning that falling oil prices is a sign of market optimism. About 11% of responses convey a negative outlook, citing that oil prices would only add to inflation and thus be a negative for stocks. In addition, 7% of respondents view oil prices as having a mixed impact, one that would negatively affect some sectors but positively impact others.
Here is a sampling of the responses:
- “Nothing out of the ordinary. I’m avoiding oil-related stocks because of all the uncertainty.”
- “Oil prices have started to come down over the last several weeks and are now trading less than $70 per barrel. That is a positive for the market.”
- “Oil prices will add to overall inflation, which has a negative impact on stock prices.”
- “Higher oil prices will cause me to be more bearish on the overall market, but in an inflationary environment oils and energy-related stocks may do well.”
- “Only a slight negative to me. Right now, it’s all about earnings with the Federal Reserve keeping to low rates. Inflation and tax increases are bigger headwinds going forward.”
Bullish: 37.0%, up 0.9 points
Neutral: 31.5%, down 0.7 points
Bearish: 31.5%, down 0.2 points
Bullish: 38.0%
Neutral: 31.5%
Bearish: 30.5%
See more Sentiment Survey results.

August 5, 2021 An Update on Inherited Retirement Accounts and Bankruptcy Protections
July 29, 2021 Making Sense of Stock Splits
July 22, 2021 The Relationship Between Brand Equity and Stock Performance
July 15, 2021 Two Measures of a Stock's Valuation

Discussion
No comments have been added yet. Add your thoughts to the discussion!
You need to log in as a registered AAII user before commenting.
Create an account