

The Relationship Between Brand Equity and Stock Performance
by Charles Rotblut | July 22, 2021
Featured Tickers: LULU
PTON
LULU
PTON
It’s not unusual to see investors gravitate toward the stock of companies they are familiar with. Often these companies have brand equity. Brand equity is the value of a brand name. Among the things a strong brand name does is to allow a company to sell its products at a higher price than its competitors. Examples include exercise equipment company Peloton Interactive Inc. (PTON) and athletic clothier Lululemon Athletica Inc. (LULU).
Some investors like the idea of owning shares in companies they admire or whose products they are fans of. Others view buying shares of such companies as fitting into the Peter Lynch methodology of “investing in what you know.” Still, there is a question as to whether investing based on brand makes sense.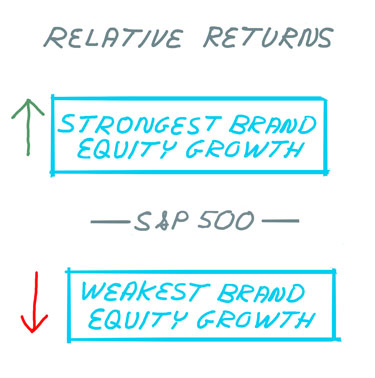
Researchers at Lynn University and Barry University crunched the numbers. They identified companies with brand equity by using data from consulting firm Interbrand. The firm’s annual Best Global Brands report identifies the 100 most valuable brands. Portfolios were then formed with the companies comprising the top and bottom rankings. A second set of portfolios were created based on brand equity growth.
Buying shares of the companies with the best brand equity did not lead to a performance advantage relative to the S&P 500 index. In fact, buying the shares of companies that ranked at the bottom of Interbrand’s list led to higher returns.
Focusing on companies with the strongest growth in brand equity, however, was a winning strategy. The outperformance was largest for a highly concentrated portfolio of the five companies with the strongest brand equity growth. Coming in at number two and number three in terms of performance were portfolios composed of stocks from the 10 and 20 companies with the strongest brand equity growth. Portfolios composed of stocks with companies having the weakest brand equity growth were also the worst performers. In academia, a factor exists if a positive return—in excess of what can be attributed to beta—can be realized by buying stocks with a strong exposure to a trait and shorting stocks with weak exposure to the trait.
Portfolio Returns Based on Ranking Companies by Growth of Brand Equity
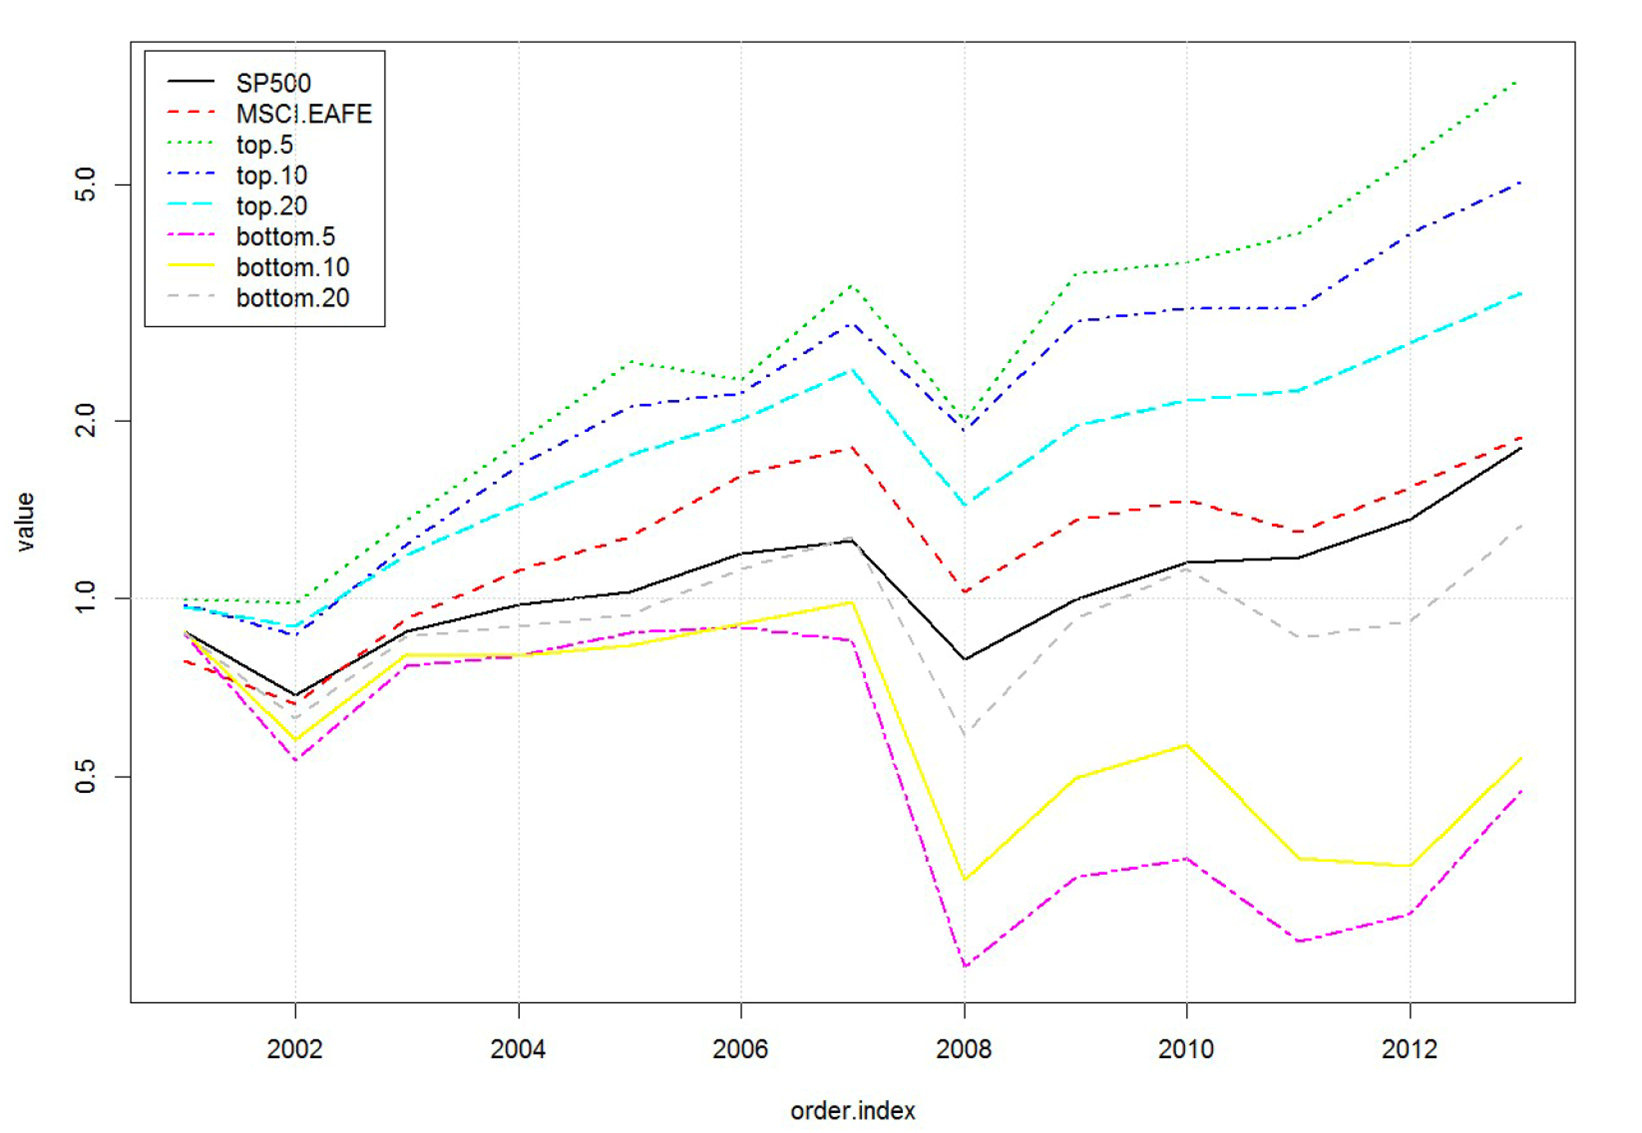
Source: “Chasing the Fame: Investing in Brand Equity,” Wei Feng, Robert Reich and Ye Sheng, SSRN.
A caveat to this study’s results is the sample period: 2001 to 2013. Though the study was recently revised, the more recent data was not included. It would have been interesting to see if the results held up during the second half of the last decade.
Still, there is a useful takeaway from the study—how a company uses its intangible assets matters. Simply having a recognizable name is not enough. A company needs to be able to grow the brand’s appeal.
But even if a company’s brand appeal is growing, there is still the question of valuation. When stocks become too popular, they run the risk of not being able to live up to expectations. This, in turn, can lead to large downside moves. An oft-overlooked part of Lynch’s strategy was to buy growth stocks at reasonable prices.

- Among the 60+ stock screens on AAII.com is our Peter Lynch Screen. Wayne Thorp discussed the screen and what it looks for in the August 2019 AAII Journal.
- Karen Firestone worked directly with Peter Lynch before starting her own investment firm. She shared some insights about Lynch’s strategy with me.
- Lynch built his reputation by successfully managing the Fidelity Magellan Fund (FMAGX). In this month’s AAII Journal, I explain how the PRISM Wealth-Building Process can help you pick the right mutual fund or ETF for your portfolio.
- We looked into revising the criteria used for determining the A+ Investor Growth Grade. We didn’t get the results we were expecting but found helpful information to share with growth investors.
- Next Wednesday, we’ll be rebroadcasting my webinar on how to find and analyze mutual funds and ETFs. Be sure to tune in.
AAII Sentiment Survey
This week saw bearish sentiment rise above the historical average for the first time in 24 weeks. Bullish sentiment declined again, falling to a 10-month low.
Bullish sentiment, expectations that stock prices will rise over the next six months, dropped 5.5 percentage points to 30.6%. Optimism was last lower on September 30, 2020 (26.2%). The historical average is 38.0%.
Neutral sentiment, expectations that stock prices will stay essentially unchanged over the next six months, rose 1.7 percentage points to 38.7%. Neutral sentiment remained above its historical average of 31.5% for the 12th time in 13 weeks.
Bearish sentiment, expectations that stock prices will fall over the next six months, rose 3.8 percentage points to 30.6%. Pessimism was last higher on February 3, 2021 (35.6%). The historical average is 30.5%.
At current levels, all three readings are within their typical historical ranges.
Timing likely played a role in this week’s results. We send out a reminder to take the survey to a rotating group of AAII members every Monday. The stock market started this week on a down note.
In this week’s special question, we asked AAII members which factors are most influencing their six-month outlook for stocks.
Many respondents list more than one answer. The coronavirus pandemic is the most cited factor, cited by 25% of all respondents. These individual investors note both signs of a recovery and the threat of new variants. Trends in government, corporate and consumer spending are listed by 22% of respondents who indicate that government, corporate and consumer spending is a key factor. Inflation is in third, picked by about 18% of respondents. Other factors include politics, future interest rates, stock and bond returns, valuation and volatility.
Here is a sampling of the responses:
- “I am bullish due to fiscal and monetary policy. There is so much stimulus, combined with recovery from the coronavirus pandemic, that our economy is roaring, at least for the next six months.”
- “I think we will have persistent low interest rates, good corporate profits and an easing of the high inflation numbers.”
- “Excessive government spending combined with proposed tax increases will result in a weakened and possibly recessionary economy.”
Bullish: 30.6%, down 5.5 points
Neutral: 38.7%, up 1.7 points
Bearish: 30.6%, up 3.8 points
Bullish: 38.0%
Neutral: 31.5%
Bearish: 30.5%
See more Sentiment Survey results.

July 15, 2021 Two Measures of a Stock's Valuation
July 8, 2021 The S&P 500's Ongoing Streak
July 1, 2021 How We Pick Benchmarks for AAII Model Portfolios
June 24, 2021 Correlations Between Stocks and Bonds Are Not Stable

Discussion
John Lambert from New Jersey posted over 5 years ago:
Not surprising. Companies with doggy businesses have to offer higher returns to attract investors. And for those doggy companies who manage to improve their business model and image; their stock price will greatly increase. This is the basis of value investing. The challenge is identifying the doggies that will improve. The companies with great products and "brand equity" are already too popular and likely over priced.
You need to log in as a registered AAII user before commenting.
Create an account