

The S&P 500's Ongoing Streak
by Charles Rotblut | July 08, 2021
The S&P 500 index’s streak of not incurring a pullback now sits at 285 days—even after factoring in today’s dip. The large-cap index declined by 9.6% in September 2020 and hasn’t looked back since.
The current ongoing streak of days without a decline of 5% or more surpassed the 1986 streak of 280 days last week. The current streak now ranks as the 17th longest since the end of 1944, according to data from Sam Stovall of CFRA Research.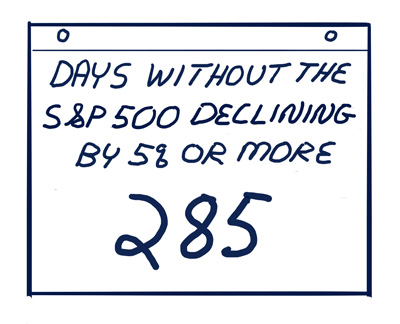
We’re going to need more smooth sailing this summer for the streak to move further up in the rankings. Streaks of 337 days between declines of at least 5% occurred in 1971 and 2004. A 327-day streak occurred in 1989.
When measured by the frequency of declines, the seas have historically been rougher. Drops of at least 5% in the S&P 500 have historically occurred approximately once every six months (an average of every 178 calendar days), according to Stovall. Wall Street Journal columnist James Mackintosh noted separately that “there were at least nine drops of more than 5% in the S&P 500” in 1999.
Volatility, like other things, is in the eye of the beholder. The daily volatility experienced year to date is on pace to be a bit above the average of the past 10 years. Through today’s close, there have been 29 days this year when the S&P 500 has incurred a daily change in value of at least 1% (10 days with a loss and 19 days with a gain). The average over the 2011–2020 period was 53 days with a daily gain or loss of more than 1%.
Relative to last year, things look very calm. The S&P 500 rose by more than 1% on 45 days and fell by more than 1% on 64 days in 2020.
The comparative drop in volatility (along with other factors—record highs, low interest rates, the return to normalcy, etc.) appears to have prompted more individual investors to open their wallets. Individual investors bought nearly $28 billion worth of stocks and exchange-traded funds (ETFs) last month, according to data cited by The Wall Street Journal from Vanda Research. This was the largest cumulative amount spent in a single calendar month since at least 2014.
Mr. Market has a tendency to stay relatively calm until he throws a tantrum. This has always been the case and there is no reason to expect things to change in the future. The timing of the next tantrum is unknown—as it always is.
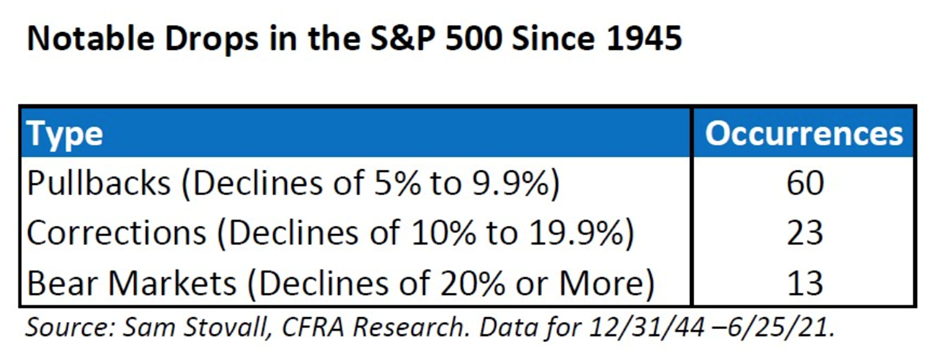
History does provide a guide for setting expectations about the severity of the next decline. The past 16 longer streaks of between-decline days were followed by average drops of 12%. The smallest decline was 5.9% (following a 476-day streak that ended in January 1955). The largest decline was the bear market drop of 28% in December 1961. (It followed a 413-day streak of no declines of 5% or greater.) Approximately half of the longer streaks were followed by single-digit percentage declines (meaning pullbacks).
There are two things to keep in mind. First, all drops start from a market top. The longer the current streak lasts, the higher the next top—and potentially the higher the next bottom—will be. Second, volatility is a phantom risk to long-term investors but a sequence risk to those who need to take withdrawals. Having dollars needed for shorter-term withdrawals allocated to cash and cash-like investments can give you the financial ability to withstand a future increase in volatility when it occurs.

- A study I cited earlier this year found that, on average, investors have “bad timing with respect to stock volatility.”
- How volatile you perceive the market to be depends on how frequently you look. A 2016 study found no discernible trend in monthly volatility over the past several decades.
- Cryptocurrency assets have experienced a very high level of volatility. This month’s AAII Journal explains the options for investing in cryptocurrency.
- Regardless of whether the market is stormy or calm, there are always stocks passing our screens. Here are 18 stocks passing five or more AAII stock screens.
- Tune in on Wednesday to see a rebroadcast of global market strategist David Lebovitz’s presentation to the AAII Los Angeles chapter.
AAII Sentiment Survey
Optimism among individual investors plunged following last week’s big gain but remains above its historical average in the latest AAII Sentiment Survey. In addition, both neutral and bearish sentiment bounced back.
Bullish sentiment, expectations that stock prices will rise over the next six months, dropped 8.5 percentage points to 40.2%. Even with the decline, optimism remains above its historical average of 38.0% for the 29th week out of the past 34 weeks.
Neutral sentiment, expectations that stock prices will stay essentially unchanged over the next six months, rose 6.1 percentage points to 35.3%. Neutral sentiment is above its historical average of 31.5% for the 10th time in 11 weeks.
Bearish sentiment, expectations that stock prices will fall over the next six months, rose 2.3 percentage points to 24.5%. Pessimism is below its historical average of 30.5% for the 22nd consecutive week.
At current levels, all three readings are within their typical historical ranges.
The return to normalcy from the coronavirus pandemic, monetary and fiscal stimulus and inflationary pressures are influencing individual investors’ outlook for stocks. Other factors include earnings, valuations and the Biden administration’s initiatives.
In this week’s special question, we asked AAII members to share how their portfolio has performed in the first half of 2021, relative to their expectations.
Nearly two out of five respondents (37%) say that their portfolios performed significantly better than expected. Some AAII members report percentage returns in the high teens. This compares to 35% of respondents who say that their portfolios performed at least slightly better than expectations. About 13% of respondents say that their portfolios’ performance was in line with their expectations. About 9% of responses say that their portfolio performed at least slightly worse to much worse than expected, with a few citing inflationary concerns.
Here is a sampling of the responses:
- “It has a return of around 16% for the year. This is better than I expected. I was looking for a return of around 6% to 8% for the year.”
- “My portfolio is up a small amount, I expected it to be somewhat higher.”
- “My portfolio is about what I expected, up around 12% year to date.”
- “A little below what I have been expecting.”
- “I do not change my asset allocation based on daily news or how I ‘feel’ about it. I select an allocation that I can live with no matter what happens. I am a long-term investor.”
Bullish: 40.2%, down 8.5 points
Neutral: 35.3%, up 6.1 points
Bearish: 24.5%, up 2.3 points
Bullish: 38.0%
Neutral: 31.5%
Bearish: 30.5%
See more Sentiment Survey results.

AAII Asset Allocation Survey
Individual investors’ exposure to equities set a new 42-month high in June according to the latest AAII Asset Allocation Survey. Fixed-income allocations, meanwhile, declined to a 32-month low.
Stock and stock fund allocations increased by 0.7 percentage points to 71.2%, marking the 13th consecutive month that allocations are above the historical average of 61.0%. Equity allocations were last higher in December 2017 (72.0%).
Bond and bond fund allocations pulled back by 0.3 percentage points to 14.7%, staying below their historical average of 16.0% for the fourth consecutive month. Fixed-income allocations were last lower in October 2018 (13.3%).
Cash allocations decreased by 1.0 percentage points to 14.1%. Cash allocations were last lower in January 2020 (13.8%). June was the 14th consecutive month cash allocations have been below their historical average of 23.0%.
Equity allocations are at an unusually high level for the fourth consecutive month. The strong rebound in the stock market continues to increase the value of equities in individual investors’ portfolios relative to other assets. At the same time, optimism in our weekly AAII Sentiment Survey was above average throughout June.
- Stocks and Stock Funds: 71.2%, up 0.7 percentage points
- Bonds and Bond Funds: 14.7%, up 0.3 percentage points
- Cash: 14.1%, down 1.0 percentage points
- Stocks: 32.2%, up 0.8 percentage points
- Stocks Funds: 39.0%, down 0.1 percentage points
- Bonds: 2.5%, up 0.3 percentage points
- Bond Funds: 12.2%, down 0.0 percentage points
- Stocks/Stock Funds: 62.0%
- Bonds/Bond Funds: 16.0%
- Cash: 22.0%
Take the Asset Allocation Survey.
July 1, 2021 How We Pick Benchmarks for AAII Model Portfolios
June 24, 2021 Correlations Between Stocks and Bonds Are Not Stable
June 17, 2021 Helpful Resources for Dividend Investors
June 10, 2021 Compound Interest Returns and Your Portfolio

Discussion
Rob from NC posted over 5 years ago:
I am very happy to see your recognition that "volatility is a phantom risk to long-term investors." It is also possible that volatility can be the "friend" of long-term investors who buy on the dips. I always try to buy when my target shows a decline for the trading day. That way I'm at least assured of not buying in at the absolute high.
AG from NJ posted over 5 years ago:
Volatility has worked very well in my actively options traded account. I keep at least 3 years of expense funds in cash or very safe cash type investments.
Monk Monk from Texas posted over 5 years ago:
Far more important than the magnitude of the drop is the pace of the drop. A gradual decline over a period of weeks or a few months can actually restore health to the market and create value for investors who either wait for dips or do dollar cost averaging. However, a fast decline tends to unnerve the market and reduce confidence that markets are well run. With automated trading over the past 5 years, one can see that market moves tend to get amplified (either up or down), and this erodes the confidence and reinforces the casino atmosphere.
You need to log in as a registered AAII user before commenting.
Create an account