

How We Pick Benchmarks for AAII Model Portfolios
by Charles Rotblut | July 01, 2021
Benchmarks can serve as useful gauges for determining the relative performance of a portfolio or fund. For our Dividend Investing, Stock Superstars and VMQ Stocks model portfolios, we use the iShares Dow Jones U.S. ETF (IYY). This ETF represents about 95% of the U.S. market by market capitalization. The iShares Dow Jones U.S. ETF’s portfolio had 1,063 holdings as of June 29, 2021.
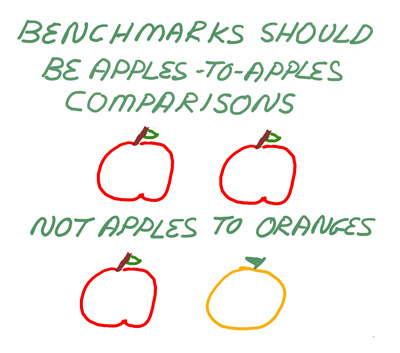
In the July Stocks Superstars Report (SSR) monthly report, my colleague Wayne Thorp explained why we use the iShares Dow Jones U.S. ETF as a benchmark. Since we both thought the discussion would be helpful to those of you trying to pick an appropriate benchmark for your own portfolios, we’re going to share a condensed version today.
As you read it, understand that benchmarks do not need to be perfect. They just need to be reasonable comparisons. Ideally, they should be alternatives you could switch to while maintaining a similar allocation. Now, here’s Wayne.
The Benchmark Used for Stock Superstars and Other AAII Model Portfolios
A good benchmark should correspond to the investment style of the investor and the expected returns from the portfolio. This means that certain benchmarks will be appropriate for certain portfolios, while, at the same time, being inappropriate for other portfolios.
A benchmark should also be a “good fit” for your portfolio in terms of the range of securities in which it can invest. A broad investment universe can potentially help increase return and reduce volatility. If the benchmark is “too narrow,” however, it may be challenging to make noticeable contributions to the portfolio’s overall performance through active management.
For example, the S&P 500 index can be used as a benchmark for a portfolio comprising large-cap U.S. stocks. However, the S&P 500 will not be an appropriate benchmark for measuring a portfolio investing in international stocks or emerging markets. The benchmark may produce information that is misleading to the investor and the portfolio manager.
When choosing the appropriate benchmark for the SSR portfolio, we considered many of the issues mentioned above. [Editor’s Note: A similar process was used to select the iShares Dow Jones U.S. ETF as the benchmark for the AAII Dividend Investing portfolio and, later, the VMQ Stocks portfolio.]
First, the SSR portfolio invests exclusively in stocks. So, it required a “pure equity” index.
Second, we considered the stocks that the SSR portfolio would invest in. AAII’s stock screening database, Stock Investor Pro, is composed mainly of U.S.-listed stocks. So, a benchmark primarily made of U.S. stocks makes sense.
The search for an appropriate benchmark for the SSR portfolio started with a popular choice: the S&P 500. The index is widely known and followed, so its visibility is a plus. However, the index only tracks the 500 largest U.S. publicly traded companies. According to S&P Dow Jones Indices, the index covers approximately 80% of available market cap. As of May 28, 2021, to be included in the index, companies must have a market cap of $11.8 billion or more. This represents 87% of the stock universe used by AAII.
So, while the S&P 500 is well-known, it is a more suitable benchmark for a portfolio of large-cap U.S. companies. When we launched the SSR portfolio in 2002, the Wilshire 5000 index was used as the benchmark.
Looking through the archive of monthly SSR newsletters, we found that we switched to the iShares Dow Jones U.S. ETF in February 2014. In that issue, we explained that the switch was made because the Wilshire 5000 provides a price change overview of the overall market, while the iShares Dow Jones U.S. ETF not only gives a performance overview of the market, but also makes visible a total return (price plus dividend reinvestment) for the domestic stock market.
While the Wilshire 5000 is a useful total-market benchmark, using the actual index meant that neither expenses nor dividends were factored into the benchmark’s returns. Furthermore, though you can buy a fund that tracks an index, you can’t invest directly in an index—a critical difference.
The change in the benchmark allowed us to show how the SSR portfolio has performed against what an investor would have realized by buying the benchmark fund and reinvesting the dividends.

- Former AAII president John Markese explained how to select an appropriate mutual fund to use as a benchmark in this 2007 AAII Journal article.
- For a diversified portfolio, more than one benchmark may be needed. Here are some suggestions of benchmark indexes to consider.
- The July AAII Journal is now online. My editor’s note includes a word of caution about lottery investments—highly risky investments with a small possibility of a big upside.
- Also in the July AAII Journal are the stocks passing the most AAII stock screens.
- Tune in on Wednesday for our latest Individual Investor Show. We’ll discuss cryptocurrencies, the latest changes to the Model Shadow Stock Portfolio and more.
AAII Sentiment Survey
Bullish sentiment among individual investors about the short-term direction of the stock market rose to its highest level since the end of April 2021. The latest AAII Sentiment Survey also shows a decrease in both neutral and bearish sentiment.
Bullish sentiment, expectations that stock prices will rise over the next six months, rose 8.2 percentage points to 48.6%. Bullish sentiment was last higher on April 22, 2021 (52.7%). Optimism is above its historical average of 38.0% for the fifth consecutive week.
Neutral sentiment, expectations that stock prices will stay essentially unchanged over the next six months, fell 7.1 percentage points to 29.2%. Neutral sentiment was last lower on April 22, 2021 (26.8%). This week’s reading is also below the historical average of 31.5%, ending a nine-consecutive-week streak of above-average readings.
Bearish sentiment, expectations that stock prices will fall over the next six months, fell 1.2 percentage points to 22.2%. Pessimism remains below its historical average of 30.5% for the 21st time this year.
At current levels, both neutral and bearish sentiment readings are within their typical historical ranges. Bullish sentiment is now back at an unusually high level. Historically, unusually high levels of optimism have been followed by lower-than-average and lower-than-median returns for the S&P 500 index over the following six- and 12-month periods.
The return to normalcy from the coronavirus pandemic, monetary and fiscal stimulus and inflationary pressures are influencing individual investors’ outlook for stocks. Other factors include earnings, valuations and the Biden administration’s initiatives.
For this week’s special question, we asked AAII members to share which industries or sectors they think are attractive buying opportunities in the current market environment. Financials ranked highest in terms of popularity, named by 22% of respondents. Many pointed to global banks as a key factor. Technology came in a close second, picked by about 21% of respondents. Industrials and infrastructure companies, including transportation and construction stocks, were listed by 20% of respondents. Energy was mentioned by about 19% of respondents.
Other sectors and industries mentioned included materials (15% of respondents); consumer discretionary sector, particularly the travel and airlines industry (14%); real estate and REITs, (9%); and health care (8%).
Several respondents listed more than one sector or industry.
Bullish: 48.6%, up 8.2 points
Neutral: 29.2%, down 7.1 points
Bearish: 22.2%, down 1.2 points
Bullish: 38.0%
Neutral: 31.5%
Bearish: 30.5%
See more Sentiment Survey results.

AAII Asset Allocation Survey
Individual investors’ exposure to equities set a new 42-month high in June according to the latest AAII Asset Allocation Survey. Fixed-income allocations, meanwhile, declined to a 32-month low.
Stock and stock fund allocations increased by 0.7 percentage points to 71.2%, marking the 13th consecutive month that allocations are above the historical average of 61.0%. Equity allocations were last higher in December 2017 (72.0%).
Bond and bond fund allocations pulled back by 0.3 percentage points to 14.7%, staying below their historical average of 16.0% for the fourth consecutive month. Fixed-income allocations were last lower in October 2018 (13.3%).
Cash allocations decreased by 1.0 percentage points to 14.1%. Cash allocations were last lower in January 2020 (13.8%). June was the 14th consecutive month cash allocations have been below their historical average of 23.0%.
Equity allocations are at an unusually high level for the fourth consecutive month. The strong rebound in the stock market continues to increase the value of equities in individual investors’ portfolios relative to other assets. At the same time, optimism in our weekly AAII Sentiment Survey was above average throughout June.
- Stocks and Stock Funds: 71.2%, up 0.7 percentage points
- Bonds and Bond Funds: 14.7%, up 0.3 percentage points
- Cash: 14.1%, down 1.0 percentage points
- Stocks: 32.2%, up 0.8 percentage points
- Stocks Funds: 39.0%, down 0.1 percentage points
- Bonds: 2.5%, up 0.3 percentage points
- Bond Funds: 12.2%, down 0.0 percentage points
- Stocks/Stock Funds: 62.0%
- Bonds/Bond Funds: 16.0%
- Cash: 22.0%
Take the Asset Allocation Survey.
June 24, 2021 Correlations Between Stocks and Bonds Are Not Stable
June 17, 2021 Helpful Resources for Dividend Investors
June 10, 2021 Compound Interest Returns and Your Portfolio
June 3, 2021 Periodic Adjustments Are Key for Preserving a Portfolio's Survival

Discussion
No comments have been added yet. Add your thoughts to the discussion!
You need to log in as a registered AAII user before commenting.
Create an account