

Investors' Timing Decisions Linked to Higher Volatility
by Charles Rotblut | February 11, 2021
One investing phenomenon is the behavior gap. The behavior gap is the difference between the return of an investment and the return that investors realize. In a recently updated study, professors at Emory University and the University of British Columbia attributed this difference to the timing of investor inflows and outflows.
The authors approached the subject from the standpoint of investing strategies. If an investor buys stock X at the beginning of a period and holds it until the end of the period (e.g., five years), their return will be the same as the stock. If this investor were to add or reduce their position in the stock during the five-year period, their return would differ. As would their realized volatility.
 Some of this difference in return is caused by the timing of cash flows. A person saving for retirement will make contributions (inflows) over time. A retiree will make withdrawals (outflows) over time. Even if a single investment, like a mutual fund, is invested in for the entire time, the investor’s realized return and volatility will be different than when it is measured for the fund itself if the position is added to or reduced. Good behavior, but a difference in outcome nonetheless.
Where the behavior gap becomes a concern is when it is caused by behavioral mistakes. I’ll quote from the study: “If investors tend to have bad timing in the sense of pouring capital into stocks after superior stock returns and before inferior returns (with the converse for redeeming capital), investor returns will be lower than stock returns.” It’s not just returns either. Again, quoting from the study, “investor timing can have substantial effects on the volatility of investor returns.”
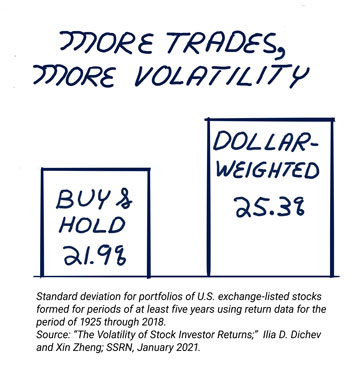
Some numbers may help to put things into perspective. Holding periods were used for exchange-listed stocks from 1925 to 2018. Two strategies were used. The first is a buy-and-hold strategy. The second is a dollar-weighted (DW) strategy. The median annualized returns were 5.2% and 4.7%, respectively, over a five-year holding period. The standard deviation—a measure of volatility—was 21.9% for the buy-and-hold approach and 25.3% for the dollar-weighted strategy.
The natural inclination is to focus on the difference in returns. The difference in volatility is more notable. The dollar-weighted approach incurred 15% more volatility. Extending the period out to 10 years resulted in 25% more volatility in the dollar-weighted approach. At 20 years, the dollar-weighted approach incurred nearly 50% more volatility.
Many investors who attempt to reduce downside volatility through their buy and sell decisions end up doing the exact opposite. Their actions lead to higher realized volatility. As the authors summed up their findings: “The results for DW returns suggest that on average investors have bad timing with respect to stock volatility. They tend to ‘chase stability’ but end up being more invested during periods of high volatility, and so their returns end up being more variable than those for corresponding stock returns.”
Dollar-weighted returns are an inescapable reality for individual investors. We add to our savings, withdraw from our portfolios and change investments over time. All of this is a part of being an individual investor. Where it becomes problematic is when these decisions are made based on emotions and expectations of what might happen instead of relying on a systematic and disciplined approach to investing.

- How volatile you perceive the market to be depends on how frequently you look. A 2016 study found no discernible trend in monthly volatility over the past several decades.
- Among the firms to document the behavior gap is DALBAR. Its president, Louis Harvey, discussed the returns that investors leave on the table due to timing mistakes and offered ways to avoid doing so.
- I provide suggestions on how to choose the right mutual fund or exchange-traded fund (ETF) for your portfolio in this month’s AAII Journal.
- Our annual ETF Guide has been moved to February. It’s accessible now on AAII.com.
- Tune in on Wednesday for the next episode of The Individual Investor Show. We’ll discuss the Model Shadow Stock Portfolio, the best- and worst-performing mutual funds, answer member questions, plus more.
AAII Sentiment Survey
The percentage of individual investors describing their short-term outlook as “bearish” is at a six-week low in the latest AAII Sentiment Survey. Optimism rebounded while neutral sentiment rose.
Bullish sentiment, expectations that stock prices will rise over the next six months, rebounded 8.1 percentage points to 45.5%. Optimism is above its historical average of 38.0% for the 11th week out of the past 13 weeks.
Neutral sentiment, expectations that stock prices will stay essentially unchanged over the next six months, rose 1.2 percentage points to 28.3%. Neutral sentiment remains below its historical average of 31.5% for the 53rd time out of the past 56 weeks.
Bearish sentiment, expectations that stock prices will fall over the next six months, fell 9.3 percentage points to 26.3%. Pessimism is below its historical average of 30.5% for the first time this year.
At current levels, all three sentiment readings are within their typical historical ranges.
The ongoing coronavirus pandemic, including the distribution of vaccines, continues to have a big influence on individual investors’ outlook for the stock market. Other factors include the new administration’s policies, economic trends, the current level of valuations and economic stimulus.
This week’s special question asked AAII members to share their thoughts about the level of optimism being reflected in the stock market.
Almost two out of five respondents (39%) say that there is too much optimism and that they believe there will be a correction. This compares to 30% of respondents who say that they are confident in the current level of optimism being reflected in the stock market. About 16% of respondents say that they are uncertain about the current level of optimism being reflected in the stock market.
Here is a sampling of the responses:
- “Optimism is being fueled by the government giving away money. It’s like we are giving money to ourselves that we will have to pay back in the form of inflation, and the inflation ‘interest rate’ is very high.”
- “Optimism has been retreating, so I think the market will not yet correct in the near future.”
- “Optimism is a reflection of expectations for the economy to grow at some level in the next six to nine months instead of being flat to negative.”
- “Recovery optimism. When the masses come out from under this pandemic, it’s euphoria. Nine to 12 months from now, reality will return, and I expect more rational stock market levels to return bringing on a correction of 15% to 25%.”
Bullish: 45.5%, up 8.1 points
Neutral: 28.3%, up 1.2 points
Bearish: 26.3%, down 9.3 points
Bullish: 38.0%
Neutral: 31.5%
Bearish: 30.5%
See more Sentiment Survey results.

February 4, 2021 Don't Fight the Hedge Funds, Invest Differently
January 28, 2021 Observations About and Lessons From GameStop's Big Rise
January 21, 2021 Pessimism Was High in 2020, but Investors Stayed With Stocks
January 14, 2021 How Much Are Mega Millions and Powerball Lottery Tickets Worth?

Discussion
Monk Monk from Texas posted over 5 years ago:
Excellent article. Indeed, the majority of investors buy over extended periods of time. One of the biggest issues that you point out to is that investors tend to buy during times of "good market performance", only to watch their holding later get pummeled when markets correct. There is a good reason for that: Periods of good market performance are usually associated with increased liquidity and more disposable income available to investors, and vice versa, in late 2008 the stock market was offered at a generational fire sale, but nobody had money then to invest. It would be easy to say hold the cash until the market presents an opportunity, but this is very difficult to do especially with bull markets extending to double-digit years in the recent history. There is also the fear of "missing out" and the zero interest rate environment that we live in. They add to fooling the investors into taking more risks.
Michael Daillak, CPA from CA posted over 5 years ago:
For more on this subject see https://buyselldonothing.com/about-us "The UNEXPECTED INSIGHT gained from his examination was that for the 27 companies for which there was a 30 year history the dividend yield on the Original Cost now ranged from 5.36% to 266.06%. More remarkably now, 30 years later, 11 of the companies were ANNUALLY PAYING a dividend (cash into the bank every year) of MORE THAN 100% of the Original Cost!! (The tickers for those 11 companies were: ABT, ADP, BMS, CTL, INTC, ITW, JNJ, KO, MCD, MKC, PEP.) The "investment approach": invest in companies that have a history of increasing their dividend, and that also every 10 or 15 years have had a "stock split") -and, to ensure diversification, the Rule: if investing $5,000, then invest $1,000 in 5 different companies; if investing $12,000, then invest $1,000 in 12 different companies; if investing more than $20,000, then invest 1/20th (5 %) in 20 different companies. (For the other 16 companies with a 30 year history, the current dividend % yield on Original Cost was: 3 companies were paying a dividend yielding less than 20% (Tickers: KMB, WMK, YORW); 10 companies were paying a dividend yielding 21% to 50% (Tickers: AGL, BMY, COP, CVX, EMR, GPC, MMM, NFG, NST, PPG); 3 companies were paying a dividend yielding 51% to 100% Tickers: CPB, LLY, PG).)" It also helps to have a very good, and easy to use, "ranking factor" FOR DIVIDEND PAYING STOCKS, which is available at this website's https://buyselldonothing.com/st-perf-indicator
Paul P from MD posted over 5 years ago:
Forgive me if this is the wrong forum to pose this question...While perusing the mutual fund issue, the number of closed funds was striking. I was wondering if any one has looked at the percentage of closed funds as a predictor (say within 6 months) of a market top. To me, this index would encompass 2 different indicators in one...a contrary (inversely proportional) indicator (retail bullishness ploughing a lot of money into the market) and directly proportional indicator..."smart money" (fund managers) that cannot find reasonable targets.
You need to log in as a registered AAII user before commenting.
Create an account