

Two Measures of a Stock's Valuation
by Charles Rotblut | July 15, 2021
Investors who rely on ratios to judge whether a stock is under- or overvalued have two measures available to them.
The first is to use absolute valuation ratios. This approach sets a firm number above which a stock will not be bought, and a second level at/above which it will be sold. An example is not buying any stocks with a price-earnings (P/E) ratio above, say, 18 or 20.
The second is to use relative valuation ratios. Relative valuations compare a stock’s current valuation to another metric. The metric can be the valuations of other stocks, the market’s valuation or the valuation range a stock has previously traded within.
Absolute and relative valuations can be used in combination. Our Model Shadow Stock Portfolio does this. It uses absolute valuation ratios for its buy and sell rules. An absolute valuation limit is used for determining which stocks qualify. This limit is adjusted based upon relative valuations. The valuation for making a portfolio holding a candidate for removal is based on the buy criteria.
To demonstrate how this works in a real-world portfolio, I’m going to share an excerpt from last month’s Model Shadow Stock Portfolio update. In it, John Bajkowski explains the logic behind the strategy’s rules and shows how considering relative valuations can impact the absolute valuations you might be willing to accept. It also shows how you can you use absolute and relative criteria for other characteristics, such as size.
The Model Shadow Stock Portfolio’s Use of Relative and Absolute Criteria
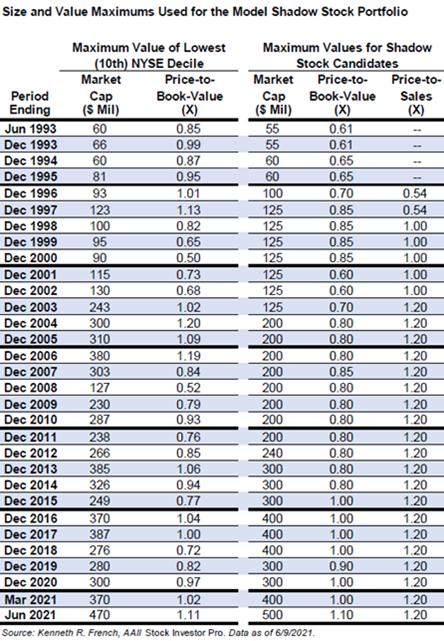
The primary Model Shadow Stock Portfolio selection criteria target the intersection of the smallest 10% of domestic stocks as measured by market capitalization, along with the “cheapest” 10% of domestic stocks as measured by the price-to-book-value (P/B) ratio. These decile breakpoints are determined by examining domestic companies that are listed on the New York Stock Exchange (NYSE) and then applying the size and value breakpoints for stocks listed in all domestic exchanges.
When the quarterly review was conducted at the start of June, the NYSE price-to-book cutoff had increased to 1.11, more than 11% above the model portfolio’s maximum initial price-to-book ratio of 1.00. Therefore, the maximum minimum initial price-to-book ratio was raised from 1.00 to 1.10. Stocks are sold for valuation if they exceed three times the minimum initial price-to-book ratio at the time of a quarterly portfolio review. We used a price-to-book cutoff of 1.10 to screen for stocks to add to the Model Shadow Stock Portfolio and 3.30 (1.10 × 3) as the maximum price-to-book ratio to keep stocks in the portfolio.
The NYSE market-cap cutoff for the lowest decile is currently $470 million, compared to the portfolio’s $370 million maximum in March, so the size cutoff was also adjusted for the Model Shadow Stock Portfolio during the quarterly review from $400 million to $500 million. The maximum market cap for inclusion in the Model Shadow Stock Portfolio is now $500 million, and holdings are sold if their market cap goes above three times the initial criterion at the time of the quarterly review: $1,500 million.

- Relative measures of valuation can be combined. Our Price-to-Sales screen compares a stock’s price-to-sales (P/S) ratio to its historical average and the median price-to-sales ratio for its industry.
- The Piotroski High-F Score strategy considers both relative and absolute metrics of fundamental strength. Learn how the strategy matches fundamental strength with a low relative valuation in the July AAII Journal.
- Relative metrics can be used for funds too. The July AAII Journal’s Mutual Fund First Cut and ETF First Cut identify funds with above-average yields and below-average levels of category risk.
- Our next Individual Investor show will air on Wednesday. We’ll discuss the role of bond ladders and annuities in retirement portfolios, how the PRISM Wealth-Building Process helps you select mutual funds and exchange-traded funds (ETFs), plus more.
AAII Sentiment Survey
Optimism among individual investors about the short-term direction of the stock market fell below its historical average for the first time in seven weeks. Meanwhile, both neutral and bearish sentiment are higher.
Bullish sentiment, expectations that stock prices will rise over the next six months, dropped 4.0 percentage points to 36.2%. Optimism was last lower on October 28, 2020 (35.3%). This is the first time in seven weeks that bullish sentiment is below its historical average of 38.0%.
Neutral sentiment, expectations that stock prices will stay essentially unchanged over the next six months, rose 1.7 percentage points to 37.0%. Neutral sentiment remained above its historical average of 31.5% for the 11th time in 12 weeks.
Bearish sentiment, expectations that stock prices will fall over the next six months, rose 2.3 percentage points to 26.8%. Bearish sentiment remains below its historical average of 30.5% for the 23rd consecutive week.
At current levels, all three readings are within their typical historical ranges.
The return to normalcy from the coronavirus pandemic, monetary and fiscal stimulus and inflationary pressures are influencing individual investors’ outlook for stocks. Other factors include earnings, valuations and the Biden administration’s initiatives.
In this week’s special question, we asked AAII members to share their thoughts about the pullback on bond yields.
Almost two out of five of respondents (39%) have negative comments about the pullback, citing concerns of inflation, low growth and low bond yields. Many respondents also say these low yields are adversely affecting retirees’ portfolios, as retired individuals may need income from safe-haven investments such as bonds.
This compares to 21% of respondents who indicate that they have no thoughts about the pullback or that it is in line with their expectations. Some respondents in this category also indicate that the low yield on bonds makes these investments unattractive and not worth the risk. About 16% of respondents say that they have a positive or more active mindset about the pullback, citing international investors looking for a higher yield and a potential increase in consumer spending. Finally, 12% of respondents say that they feel the pullback is temporary and some say that it indicates a sign of economic growth and recovery.
Here is a sampling of the responses:
- “Tougher for fixed income and retirement planning—I cannot depend on bond income. Will need to have either dividend-paying stocks or mutual funds or sell capital to pay the bills.”
- “I have very little (<1%) invested in bonds. So this has little effect on my portfolio.”
- “It will start affecting those on fixed income, particularly retirees, but will help those who are interested in purchasing real estate and possibly increase spending by consumers.”
- “The recovery will have times when it does not look perfect. Certain things will slow, others will pause. This is normal during a recovery. We have been spoiled by near-perfect policy and huge stimulus. It will take some time to get the economy on its feet. This is a transition to stability on its own. This is transitory.”
Bullish: 36.2%, down 4.0 points
Neutral: 37.0%, up 1.7 points
Bearish: 26.8%, up 2.3 points
Bullish: 38.0%
Neutral: 31.5%
Bearish: 30.5%
See more Sentiment Survey results.

July 8, 2021 The S&P 500's Ongoing Streak
July 1, 2021 How We Pick Benchmarks for AAII Model Portfolios
June 24, 2021 Correlations Between Stocks and Bonds Are Not Stable
June 17, 2021 Helpful Resources for Dividend Investors

Discussion
No comments have been added yet. Add your thoughts to the discussion!
You need to log in as a registered AAII user before commenting.
Create an account