

Stock Market Returns Following Military Conflicts
by Charles Rotblut | February 24, 2022
Prior to today’s military attack on Ukraine by Russia, I had been receiving reports from various strategies and investment firms about the impact of war on stocks. The common theme is a short-term downturn followed by higher prices.
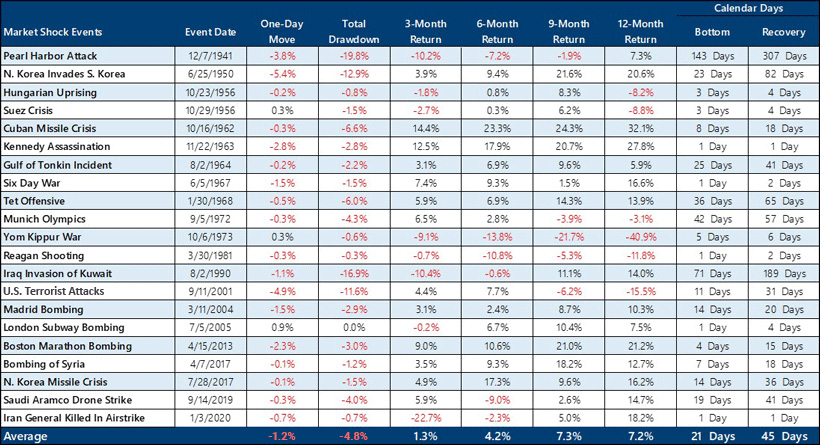
Calamos Wealth Management’s Investment Strategy Group put together the most comprehensive tables I’ve seen of geopolitical conflicts dating back to World War II. The average total drop (aka drawdown) in the S&P 500 index from the event date to the bottom was 4.8%.
Averages, of course, are influenced by the upper and lower ends of the data. The Calamos table—which is shown at the bottom of today’s commentary—includes the attempted assassination of past President Ronald Regan in 1981, the London subway bombing in 2005 and the killing of Iranian general Qasem Soleimani in 2020. Following these events, the S&P 500 incurred total drawdowns of –0.3%, 0.0% and –0.7%, respectively. 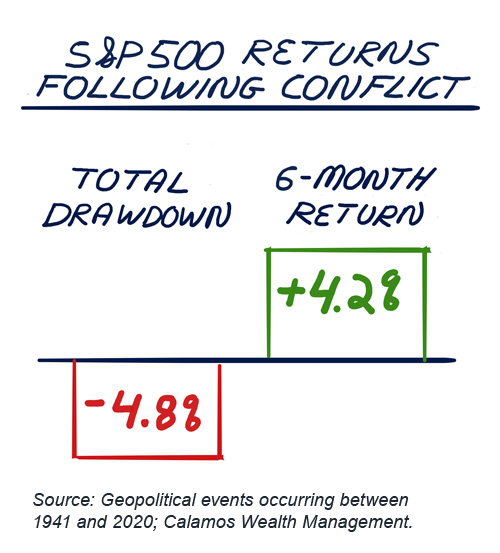
The large-cap index’s total drawdown reached double-digits in percentage terms just four times. The index plunged 19.8% in response to the 1941 attack on Pearl Harbor. The start of the Korean War in 1950 was followed by a 12.9% drop. A 16.9% correction followed the Iraq invasion of Kuwait in 1990. Finally, an 11.6% drop in the S&P 500 occurred after the 9/11 attacks in the U.S.
Outside of these events, the S&P 500 incurred the equivalent of a pullback (a drop of between 5% and 10%) just twice. The index incurred a 6.6% drawdown after the Cuban Missile Crisis in 1962. The 1968 Tet Offensive in Vietnam was followed by a 6.0% drop.
On average, the S&P 500 bottomed 21 days after the event date and took 45 days to recover. Two events skew these numbers. The large-cap index went 143 days following the Pearl Harbor attack before it finally bottomed. The S&P 500 went 71 days after the Iraqi invasion of Kuwait before bottoming.
Both times, there were other macro factors at play. Following Pearl Harbor, Europe remained engaged in a full-scare war while Japan was continuing military strikes in the Pacific and in eastern Asia. At the same time, the U.S. was continuing to deal with the aftermath of the Great Depression and the subsequent 1937–1938 recession. In 1990, the U.S. economy fell into a recession. The recession was brought on, in part, by higher oil prices and rising interest rates.
On the other hand, the S&P 500’s reaction to the start of the Yom Kippur War in 1973 was short, with the index bottoming within five days. Twelve months after the October 6, 1973, event date, the S&P 500 was down 40.9%. A combination of the oil embargo, crashes in several stock markets (especially London) and stagflation were all among the contributors to the drop.
The typical pattern has been for the S&P 500 to have an initial reaction to a geopolitical event and then move past it. The average length of time between the event date and the full recovery from a “reaction drop” has been 66 days in total.
At periods of six months or longer, other factors have influenced the market’s direction. While some of the factors stemmed from or were related to the conflict, the conflict by itself has not tended to be a lasting driver.
As I write this, there are still several known unknowns pertaining to Ukraine and the extent of sanctions against Russia in response to the attack. Russia is a big supplier of natural gas to Europe: The Wall Street Journal says, “Russian energy accounts for about 40% of the gas the EU imports.” Russia is also a big supplier of several other commodities. Higher commodity prices have a ripple effect across global economies. There can also be fallout from financial sanctions due to companies having direct or indirect exposure to Russia. Obviously, any time there is a military conflict, there is the risk of it worsening or spreading. We hope this does not happen.
There are various other factors at play that could influence the direction of the global equity, fixed-income and commodity markets. The coronavirus remains a threat with the potential for new mutations to occur. Supply chain issues persist. Many central banks around the globe have raised or are considering raising rates. Here in the U.S., the Federal Reserve is expected to begin raising rates in a few weeks. At the same time, the global economy continues to open up and supply chain issues could lessen as the year progresses.
As investors, we don’t get to choose the financial market conditions we live through, much less the geopolitical conditions we live through. Systematic risk (the risk of doing anything with your money) never fully goes away. But the bigger risk to most investors’ portfolios is behavioral in nature—making big portfolio decisions based on short-term events instead of staying focused on achieving longer-term financial goals.
Source: LPL Research, S&P Dow Jones Indices, CFRA, Bloomberg. Past performance doesn’t guarantee future results. The illustrated returns are reflective of the performance under the stated timeframe for the S&P 500 Index and beginning with the “event date.” The S&P 500 index is a stock market index that tracks performance of 500 U.S.-based large-cap companies from various sectors. It is widely considered a gauge of investor sentiment and its returns reflect the state of the American economy.

- A 5% to 15% allocation to commodities has provided diversification benefits as well as boosted returns during periods of restrictive monetary policy, as this 2010 AAII Journal article shows.
- Our exchange-traded fund (ETF) guide includes 114 ETFs classified as providing exposure to commodities.
- As you look at how various types of investments are performing in response to the conflict, realize that no single asset class category outperforms every year.
- PRISM Academy Step 3, Lesson 6 is the final portion of Identifying Your Investment Management Preferences. You will choose how your portfolio will be managed after learning in Lessons 1–5 how your personal preferences and constraints impact this decision.
“Who votes institutional and pension funds for their holdings? The largest holders of Disney stock as far as I can tell are Vanguard Group and BlackRock, which are pension holders for large entities. Is it one person or is it a committee at those quite opaque institutions that vote shares and pick directors?”
Click here and then choose the Join the Community button on the right to answer this question and read other responses.
AAII Sentiment Survey
The results from the latest AAII Sentiment Survey show the percentage of individual investors describing their six-month outlooks for stocks as “bearish” reaching its highest level in nearly nine years. In addition, optimism rebounded but remains well below normal levels.
Bullish sentiment, expectations that stock prices will rise over the next six months, increased 4.1 percentage points to 23.4%. Optimism is below its historical average of 38.0% for the 14th consecutive week. It remains at an unusually low level for the seventh consecutive week.
Neutral sentiment, expectations that stock prices will stay essentially unchanged over the next six months, plunged 14.6 percentage points to 22.9%. This is the first week neutral sentiment is below the breakpoint between typical and unusually low levels (23.1%) since April 15, 2021 (21.6%). The historical average is 31.5%.
Bearish sentiment, expectations that stock prices will fall over the next six months, jumped 10.5 percentage points to 53.7%. This is bearish sentiment’s 14th consecutive week above the historical average of 30.5%. Pessimism was last higher on April 11, 2013 (54.5%).
The bull-bear spread (bullish sentiment minus bearish sentiment) remains unusually low at –30.3%. It was last lower on April 11, 2013 (–35.2%).
Historically, the S&P 500 index has gone on to realize above-average and above-median returns during the six- and 12-month periods following unusually low readings for bullish sentiment and for the bull-bear spread. Unusually high bearish sentiment readings historically have been followed by above-average and above-median six-month returns in the S&P 500.
Inflation, interest rates, the coronavirus pandemic and politics are all influencing individual investors’ outlook for stocks. Other factors include the economy and corporate earnings. The ongoing volatility in the stock market is likely also playing a role.
The survey period runs from Thursday through Wednesday. We point this out because this week’s special question asked how the situation with Russia and Ukraine is impacting members’ short-term outlook on stocks.
Half (50%) of respondents say that the unfolding events in Ukraine are giving them a bearish outlook on stocks. Many of these respondents say that they are becoming more cautious and view the situation as dangerous.
Conversely, 25% of respondents say that the Ukraine crisis is having no impact on their outlook for stocks because they believe the situation is very short-term and are heavily focused on the long term.
Around 13% have a mixed outlook. Roughly 7% of respondents have a bullish outlook and view the situation involving Ukraine and Russia as a buying opportunity or a short-term blip. Lastly, about 6% of responses fell into the “other” category.
Here is a sampling of the responses:
- “The situation in Ukraine is definitely very bad and has a negative effect on the stock market for the foreseeable future.”
- “No impact, I’m a long-term investor.”
- “If Ukraine is invaded by Russia, then the market will go down to a level that investors are comfortable with on a risk/reward basis. The market will rally based upon stability coming to the Ukraine-Russia issue and then economic growth and profitability will determine the next leg up or down.”
- “I think the issue will be resolved within the next six months, and the coronavirus pandemic will be gone. After those two issues are finished, the stocks will be going back into a bull market.”
Bullish: 23.4%, up 4.1 points
Neutral: 22.9%, down 14.6 points
Bearish: 53.7%, up 10.5 points
Bullish: 38.0%
Neutral: 31.5%
Bearish: 30.5%
See more Sentiment Survey results.

February 17, 2022 The Small-Cap Premium Is Below Its Historical Median
February 10, 2022 Time to Embrace Instead of Abandon Value?
February 3, 2022 A Sign of Light for Value Investors
January 27, 2022 Smart Investing Steps You Can Take During the Current Bout of Volatility

Discussion
Robert Bullard from Oregon posted over 4 years ago:
Very helpful article. Thanks Charles!
Dr. Lawrence Wasserman from MD posted over 4 years ago:
Fantastic article Charles .... very insightful. Long time ago Rick Edelman on his radio show portrayed the best and worst x days of market during 50-year period (forgot exact number of years) illustrating that if you sold or bought the wrong time period that would result in significant impact on one's portfolio. Cheers, Lawrence
Barry J from TX posted over 4 years ago:
“Past performance doesn’t guarantee future results” and yet we continually look to “data”[?] of past events for clues to improve future decisions. I remember reading (somewhere in some distant undergraduate course) about a tribe in the Pacific Northwest that hunted whales. The Shaman would gather up and burn some whale bones from past hunts, rake through the embers, and then point in the direction where “the Great Spirits” forecasted whales would be bountiful. The hunters would row off in that direction. Sometimes they found whales, and the tribe would feast. Sometimes they would not, and the tribe would have eat berries and bark. When the shaman was asked why a hunt had failed, he would say, “Bad bones.” The source is the shaman. “Past performance doesn’t guarantee future results” is the Great Spirit. We are the tribe. The table may be “Bad bones.”
You need to log in as a registered AAII user before commenting.
Create an account