

The Small-Cap Premium Is Below Its Historical Median
by Charles Rotblut | February 17, 2022
During the past two weeks, I’ve written about the possibility of a rotation occurring from favoring growth stocks to favoring value stocks. This week, I’m going to approach the subject from a different standpoint: the possibility of a rotation from large-cap stocks to small-cap stocks.
In his latest Model Shadow Stock Update, AAII president John Bajkowski referenced James O’Shaughnessy’s focus on long-term market cycles. O’Shaughnessy’s work points to the benefit of using a 20-year perspective when making strategic portfolio allocation decisions. O’Shaughnessy also advised taking inflation into account when looking at long-term cycles. 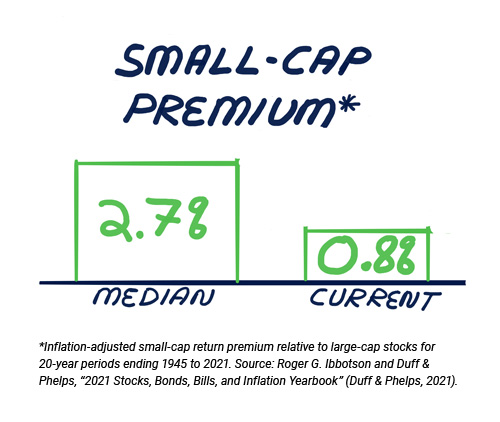
Based on this, Bajkowski compared the 20-year real (inflation-adjusted) rate of return for the S&P 500 index against the premium for small-cap stocks. The premium is the extra return investors have received for investing in smaller companies. To the extent small-company stocks are riskier, investors rightfully demand higher returns as compensation.
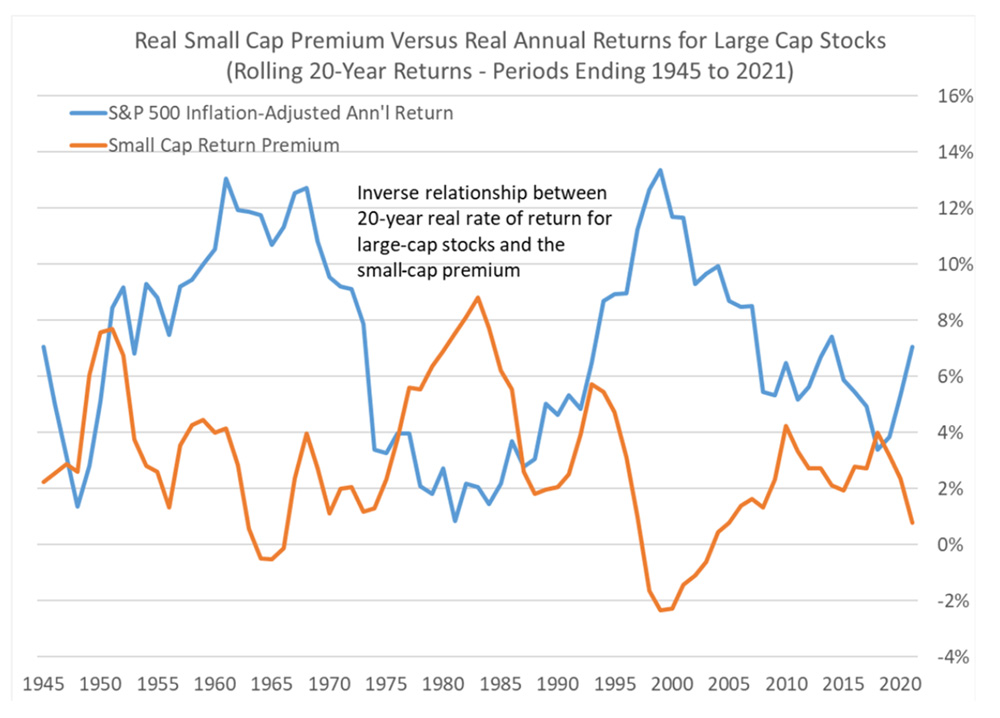
In the chart I’ve included at the end of this week’s commentary, the blue line shows the inflation-adjusted compound annual return over rolling 20-year periods for large-cap stocks as defined by the S&P 500, while the orange line shows the inflation-adjusted small-cap premium observed over the same rolling 20-year periods. The two lines reveal an inverse relationship between large-cap stock returns and the small-cap premium. The best opportunities for small-cap stocks come after a period of strong large-cap performance accompanied by a poor observed small-cap premium.
I used Bajkowski’s data to calculate the ranges. The median rolling 20-year premium—the extra return realized—for small-cap stocks is 2.7%. This is a sizeable advantage when compounded over time. Small caps enjoyed their largest premium, 8.8%, during the 20-year period ending in 1983. The small-cap premium was the lowest during the 20-year period ending in 1999 at –2.3%—not too surprising the given the dot-com bubble.
As of the end of 2021, the small-cap premium was 0.8%. This is well below the median, but above the lows we’ve previously seen. The small-cap premium was negative during nine out of the last 77 rolling 20-year periods. Negative premiums occurred in 20-year rolling periods ending in the mid-1960s and in the late 1990s/early 2000s.
Bajkowski described how the current data shows that the relationship between the real return of large-cap stocks and the small-cap premiums is not at an extreme level. This said, the past 20-year period slightly favors small-cap holdings over large issues, assuming historical relationships hold.
When looking at small-cap stocks, it is important to the realize the small-cap premium has been driven by small-cap value. Over the long term, small-cap growth stocks have underperformed when measured by price-to-book value. Thus, if you think small-cap stocks could outperform in the future, there is an argument for favoring small-cap value over small-cap growth.
Source: Roger G. Ibbotson and Duff & Phelps, “2021 Stocks, Bonds, Bills, and Inflation Yearbook” (Duff & Phelps, 2021).

- Here is John Bajkowski’s latest Model Shadow Stock update, which looks at the long-term cycles of large- and small-cap stock returns.
- The subject of rotation among the top-performing asset class categories will be among those we’ll discuss in our latest Individual Investor Show, which will air on Wednesday.
- If you watched the Super Bowl last Sunday, you saw several ads for cryptocurrency companies. What they didn’t tell you is that ownership and mining of bitcoin are concentrated.
- In Lesson 5 of PRISM Academy Step 3, Identifying Your Investment Management Preferences, we discuss who will be managing your portfolio. If you need specific assistance with tasks or general financial planning, you will need to decide whether to seek help from a financial professional or be self-reliant.
AAII Sentiment Survey
The results from the latest AAII Sentiment Survey saw bullish sentiment drop to its 29th lowest level since the survey started in 1987. In addition, the percentage of investors describing their outlook for stocks as “neutral” decreased while pessimism increased.
Bullish sentiment, expectations that stock prices will rise over the next six months, decreased 5.1 percentage points to 19.2%, well below the historical average of 38.0%. Optimism was last lower on May 25, 2016 (17.8%). Bullish sentiment is unusually low for the sixth consecutive week and below its historical average for the 13th consecutive week.
Neutral sentiment, expectations that stock prices will stay essentially unchanged over the next six months, decreased by 2.6 percentage points to 37.6%. This is the ninth time out of the past 11 weeks that neutral sentiment is above its historical average of 31.5%.
Bearish sentiment, expectations that stock prices will fall over the next six months, rebounded by 7.7 percentage points to 43.2%, staying above the historical average of 30.5%. This is bearish sentiment’s 13th consecutive week above the historical average. It is also the fourth time in the past five weeks that pessimism is unusually high.
As noted above, bullish sentiment is at an unusually low level for the sixth consecutive week. Historically, the S&P 500 index has gone on to realize above-average and above-median returns during the six- and 12-month periods following an unusually low reading for bullish sentiment. The bull-bear spread (bullish sentiment minus bearish sentiment) is also unusually low at –23.9%. Such readings have also been historically followed by above-average and above-median returns for the S&P 500 over the following six- and 12-month periods.
Inflation, interest rates, the coronavirus pandemic and politics are all influencing individual investors’ outlook for stocks. Other factors include the economy and corporate earnings. The ongoing volatility in the stock market is likely also playing a role.
In this week’s special question, we asked AAII members to share their thoughts about how supply chain issues are impacting their investing decisions. About 60% of respondents say that supply chain issues are having little to no impact on their decisions since many are long-term investors and supply chain issues are perceived as a short-term problem.
Conversely, 12% of respondents say that supply chain issues are having a negative impact on their investment decisions. Around 9% cite a specific stock impact, mentioning their own strategy of moving toward or away from certain kinds of stocks. Additionally, 8% of respondents say that the supply chain is having a positive impact on their decisions, presenting them with buying opportunities. Roughly 3% of respondents have mixed feelings about how supply chain issues are impacting them and 2% of respondents are neutral. Only 2% of respondents mention a specific bond impact arising due to supply chain issues.
Here is a sampling of the responses:
- “Not much. I’m a long-term investor.”
- “Empty shelves at drug and grocery stores ... not good.”
- “I am thinking more about investing in energy and financial stocks. There already is a substantial investment in their supply chain (hydrocarbons, money and credit). Maybe I should look at utility stocks along with certain real estate investment trusts (REITs).”
- “Seeing signs of improvement.”
- “I think the supply chain issues are transitory, but I am not sure how to invest based on that belief except to discount those issues in figuring the long-term value of assets.”
Bullish: 19.2%, down 5.1 points
Neutral: 37.6%, down 2.6 points
Bearish: 43.2%, up 7.7 points
Bullish: 38.0%
Neutral: 31.5%
Bearish: 30.5%
See more Sentiment Survey results.

February 10, 2022 Time to Embrace Instead of Abandon Value?
February 3, 2022 A Sign of Light for Value Investors
January 27, 2022 Smart Investing Steps You Can Take During the Current Bout of Volatility
January 20, 2022 Portfolio Allocations Often Do Not Follow Shifts in Sentiment

Discussion
Josh D from PA posted over 4 years ago:
A rotation to small caps would be interesting because the market is so dominated now by huge mutual and index funds. They really can't participate in small caps at any meaningful level without moving the stocks against themselves. Looking at all companies in SI Pro and ranking by Market Cap, it looks like approximately 60% are Small Cap (<$2B). But what percentage of the total market cap do they represent? One could calculate that using SI Pro I suppose. I've always argued it IS possible if not easy for reasonably skilled individual value investors to beat leading fund manager performances because of the advantage we have utilizing significant allocations of growing or "rebounding" small caps, as well as LEAPs, whereas the large funds managers can't utilize them to any meaningful degree unless failing to sort out good ones and merely buy a large swath of small caps and thereby defeating the whole concept and goal of managing a fund. Warren Buffett states it another way, saying the universe of great investment opportunities for a small amount of money is huge. But when you get into the tens and hundreds of millions the opportunities diminish greatly. I guess that's why he has shifted to a tactic of buying entire businesses primarily by pulling heart strings to gain an advantage over other large buyers lol. So without question yes we 'small investors' should be capitalizing on small caps!! But success still lies in separating the gems from the garbage, not separating small caps from large caps.
none from WI posted over 4 years ago:
Comments not posting....
Dahai Chang from Texas posted over 4 years ago:
For your chart, what do you use for small-cap? The chart seems to show reverse correlation between large and small cap. Does this mean the correlation would be negative between the two? Thanks.
Dahai Chang from Texas posted over 4 years ago:
For your chart, what do you use for small-cap? The chart seems to show reverse correlation between large and small cap. Does this mean the correlation would be negative between the two? Thanks.
Barry from TX posted over 4 years ago:
The only issue wish to raise about small cap value investing is the issue of base rates. As Josh D points out in his comment above, “60% are Small Cap (<$2B).” That is why they are called “small” caps. They have much a smaller capital base than “large” caps that can be 1,000 large like AAPL and MSFT which are >$2T. Or even larger yet than “micro-caps” in the lower end of the small cap valuation range. This is where the “base rate effect” is often ignored by otherwise “rational” investors. See Kahneman (1979) for examples of how “rational” people ignore base rates. Example: If, as the article says, over the last 20 years, “rational” “value” investors earned 0.8% (or 0.008) on their “small cap value” investments. (Remember, they qualify to be in the “small cap” group because they have a LOWER asset base (<$2B). “Rational” small cap value investors shared gross earnings of $2B x 0.8% = $16M while “irrational” “large cap” “momentum” investors earned MORE THAN >0.008 on a LARGER base (>$2B). Even if the “large cap“ “irrational” advantage” is only 0.001 MORE, they earned AT LEAST 1,000 times MORE on average, which easily offsets any “equity premium” they paid for higher “multiples” ranging up to 100 times earnings. They current average equity premium is 20 times to 30 times earnings.
You need to log in as a registered AAII user before commenting.
Create an account