

Don't Abandon Diversification Because of This Year's Rough Patch
by Charles Rotblut | May 05, 2022
Featured Tickers: VFIAX
VFIDX
VFSAX
VGSLX
VSIAX
VFIAX
VFIDX
VFSAX
VGSLX
VSIAX
Diversification can appear to not work when looked at over shorter periods of time. We are in one of those periods.
My 403(b) retirement plan account provides an example of this. When I looked at it last weekend as part of my semiannual review, I saw nothing but red in the year-to-date returns. Domestic stocks down. Foreign stocks down. Real estate down. Bonds down.
The Wall Street Journal noted the recent rise in correlations between stocks and bonds yesterday. The S&P 500 index and the Bloomberg U.S. Aggregate bond index “are on track for their biggest simultaneous drop in Dow Jones Market Data going back to 1976,” according to the newspaper. The only time both indexes incurred a full-year drop in the past 46 years was in 1994.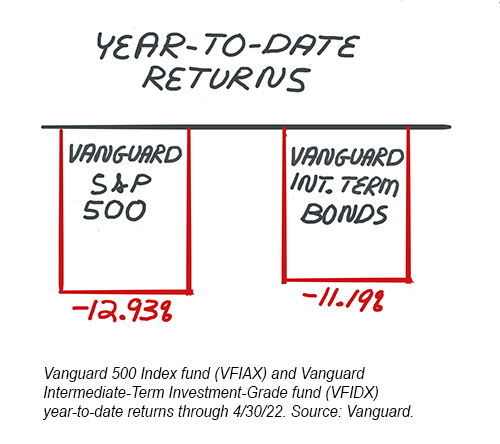
Everybody is familiar with the primary reasons 2022 is currently on track to potentially be the second such year.
On the stock side, supply chain issues are restricting revenue growth for many corporations. Higher inflation is weighing on profit margins. Valuations still aren’t cheap—and even remain expensive for some tech stocks. Russia’s ongoing attack on Ukraine continues to create uncertainty.
On the bond side, inflation is also having a large impact. Yesterday’s 50-basis-point rate hike by the Federal Reserve will probably be followed by further rate hikes, including a couple more half-point raises. Bond traders adjust for this by demanding higher yields, which in turn drives bond prices down.
Combined, these factors have resulted in correlations rising across asset classes. Here are the year-to-date returns (through April 30) for two of the funds I hold in my 403(b) account:
-
Vanguard 500 Index Admiral fund
 (VFIAX): –12.93%
 -
Vanguard Intermediate-Term Investment-Grade Admiral fund (VFIDX): –11.19%
Not much daylight between the two. Those following a traditional 60% stock/40% bond allocation haven’t seen the diversification benefits so far this year. And those venturing beyond large-cap domestic stocks on the equity side haven’t easily avoided losses either. Consider the year-to-date returns of the other three funds I hold in my 403(b) account:
-
Vanguard Small-Cap Value Index Admiral fund (VSIAX): –7.49%
-
Vanguard FTSE All-World ex-US Small-Cap Index Admiral fund (VFSAX): –14.00%
-
Vanguard Real Estate Index Admiral fund (VGSLX): –9.91%
Does this mean diversification is broken? No. Just because asset classes or asset class categories are not correlated or have reduced correlations does not mean they will never move in lockstep together. Correlations widen and narrow over time. Asset classes with different return characteristics will sometimes not only cross paths but go down the same path together for periods of time.
Over longer periods, diversification does reduce portfolio volatility. When one asset class or asset class category zigs, another zags. Diversification also increases the odds of being allocated to the right asset class/asset class category at the right time. Neither makes diversification immune from the same risk all other allocation strategies face—there have been and will continue to be shorter-term periods when it just doesn’t work well.
If we had working crystal balls, managing a portfolio would be much easier. We don’t and neither does anybody else—especially those pundits and strategists who would try to claim otherwise. Fortunately, the financial markets reward investors who follow disciplined allocation strategies, incorporate both market history and evidenced-based approaches and don’t make big bets on uncertain outcomes. It can take time to realize those rewards, but history shows us that those rewards do come.
As far as my 403(b) account is concerned, I made no changes. I remain comfortable with the allocation and the funds used. Rebalancing was also not needed, since no single fund was too overweighted or underweighted. Hopefully, I’ll see better year-to-date returns when I next look at the account six months from now.

- Given today’s drop, I posted data in our Allocation Strategies community showing where the S&P 500 currently is relative to past drops in the market.
- The portfolio strategy insights and suggestions given by Vanguard chairman emeritus Jack Brennan in October 2021 may well be worth rereading now.
- The new May AAII Journal is now online. In it, we discuss the impact war and inflation have had on mutual fund and exchange-traded fund (ETF) returns.
- We also discuss our earnings estimate revision screens in the May issue of the Journal. The upward revision screens help you find potentially attractive stocks that analysts have become more optimistic about.
- In Step M, Lesson 2 of the PRISM Academy, we discuss how to effectively monitor your allocation. The aim is to determine if your portfolio continues to be properly allocated relative to your goals and tolerance for risk. Click here to complete Lesson 2.
Participate
Members are looking for your input. Can you help with this question from the Retirement Withdrawals Community?
“Moving toward zero taxable income in retirement ... Should I be stopping the conversions prior to being 100% in Roth IRAs?”
Tap the button and then choose the Join the Community button on the right to answer this question in the AAII Community.

AAII Sentiment Survey
The results from the latest AAII Sentiment Survey show the percentage of individual investors describing their outlook as “neutral” falling to its lowest level in 18 months. In addition, optimism rebounded while bearish sentiment pulled back.
Bullish sentiment, expectations that stock prices will rise over the next six months, jumped by 10.4 percentage points to 26.9%. The big move was not enough to prevent optimism from staying below its historical average of 38.0% for the 24th consecutive week. Bullish sentiment also remains at an unusually low level for the 14th time out of the last 17 weeks.
Neutral sentiment, expectations that stock prices will stay essentially unchanged over the next six months, fell by 3.9 percentage points to 20.3%. Neutral sentiment was last lower on November 11, 2020 (19.3%). The historical average is 31.5%.
Bearish sentiment, expectations that stock prices will fall over the next six months, fell 6.5 percentage points to 52.9%. This is the 23rd time out of the last 24 weeks that pessimism is above its historical average of 30.5%. It is also the 13th time out of the last 16 weeks that bearish sentiment is at an unusually high level.
At current levels, bullish sentiment, neutral sentiment and the bull-bear spread (bullish minus bearish sentiment) are all unusually low. Meanwhile, bearish sentiment is unusually high. It is rare for all four indicators to be at unusual levels on the same week.
Historically, the S&P 500 index has gone on to realize above-average and above-median returns during the six- and 12-month periods following unusually low readings for bullish sentiment and for the bull-bear spread. Unusually high bearish sentiment readings historically have also been followed by above-average and above-median six-month returns in the S&P 500.
Most of the responses to this week’s survey were registered before the statement from yesterday’s Federal Open Market Committee meeting was released, which announced a raise in interest rates.
The ongoing invasion of Ukraine by Russia, stock market volatility, inflation, interest rates, the coronavirus pandemic and politics are all influencing individual investors’ outlook for stocks. Other factors include the economy and corporate earnings.
In this week’s special question, we asked AAII members whether they think other investors are currently too bullish or too bearish.
Slightly more than half of respondents (54%) feel that other investors are too bearish. Many of these respondents believe that some of the market’s uncertainty is already reflected in prices. Conversely, 19% of respondents say that other investors are too bullish. Many warn of an impending recession attributed to inflation and the Russia-Ukraine conflict. Around 18% of respondents express a neutral or moderate outlook and/or feel that other investors are gauging the market correctly in terms of bullishness or bearishness.
Here is a sampling of the responses:
- “Too many people are waiting for the flush to buy (capitulation). A lot of doomers who missed out on major gains in 2021 are salty and want the market to crash and go back to the old ways. I think we will finish 2022 at the highs.”
- “Probably a bit too bearish but that’s because polls like this one are as bearish as I’ve ever seen and unemployment is near as low as I’ve ever seen. Quite the conundrum.”
- “Perhaps a little bullish. We still don’t know what effect the Federal Reserve raising interest rates will have going into an already contracting economy.”
- “Too bullish, don’t fight the Fed! As long as the Fed is pursuing an aggressive tightening policy, stay away from stocks!”
- “About right.”
Bullish: 26.9%, up 10.4 points
Neutral: 20.3%, down 3.9 points
Bearish: 52.9%, down 6.5 points
Bullish: 38.0%
Neutral: 31.5%
Bearish: 30.5%
See more Sentiment Survey results.

April 28, 2022 Remembering Geraldine Weiss and Her Winning Dividend Strategy
April 21, 2022 A Costly Example of Why Asset Location Matters
April 14, 2022 Don't Let Fear Cause You to Miss the Best Days in the Stock Market
April 7, 2022 Five Key Investing Concepts

Discussion
Rob from NC posted over 4 years ago:
Stay the course! Steady as she goes! Rough waves just add excitement to the ride.
Tom from MN posted over 4 years ago:
The fact that both stocks and bonds are going down in the current market reminds me of the real distinction between bonds and bond funds. While stock funds are an excellent mechanism for diversification (as compared to individual stocks), bond funds are a completely different animal from individual bonds. (I make the assumption that individual investors buy bonds to hold them to maturity.) Buying individual bonds (or CDs) guarantees there will be no capital appreciation or depreciation (assuming the bond doesn't default). Only an income stream for a fixed period of time. Bond funds, on the other hand, expose the buyer to interest rate fluctuations. Over a few decades, with generally decreasing interest rates, that has led to price appreciation for bond funds. In fact, the majority of the total return has come from price appreciation. I'd venture to guess that is unlikely to continue in the near term. I think people will be sorely disappointed if they think bond funds will offset their losses in stock funds.
Barry from TX posted over 4 years ago:
Since my only experience is landing USAF aircraft on fixed runways. So I asked a Naval Aviator I knew what it was like to make a night carrier landing. SHE replied: It is like having sex in the back seat of a car ... while going off a cliff." That gnomic aphorism seems to apply to markets in 2022.
You need to log in as a registered AAII user before commenting.
Create an account