

Don't Let Fear Cause You to Miss the Best Days in the Stock Market
by Charles Rotblut | April 14, 2022
Special note: If you are looking for ideas from four model portfolios with proven histories of finding winners, now is an ideal time to join AAII Platinum. You’ll get discounted access to our premium newsletters and our investment discovery tool. Plus, AAII Platinum members get exclusive access to our newest newsletter—and free access to it once it goes live!
The latest inflation data only added to the potentially nerve-wracking headlines investors have been seeing. The March consumer price index (CPI) rose 8.5% on a year-over-year basis. Gasoline prices accounted for half of the increase. Core CPI, which excludes food and energy, jumped by 6.5% on a year-over-year basis. 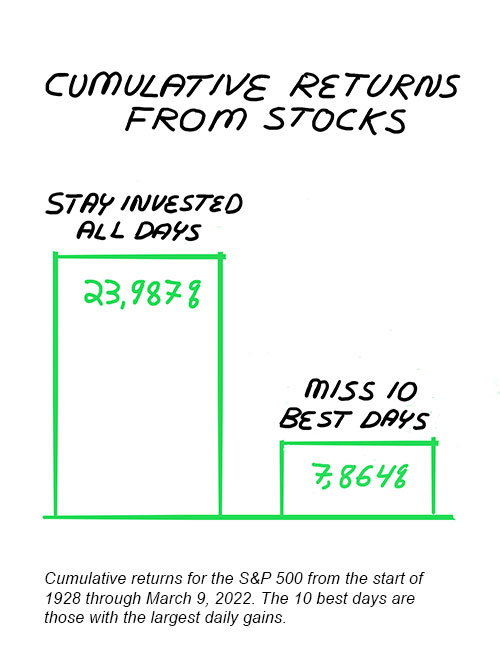
As investors, we don’t get choose the type of markets that exist over our life-spans. This year, so far, is certainly not shaping up to be one many of us would voluntarily choose. The major stock indexes remain in a correction (a bear market for the Nasdaq composite). The number of days with the S&P 500 index closing up or down by more than 1% is on track to exceed the 10-year annual average. Bond yields have been on the rise. The yield curve has flattened (but not signaled a forthcoming recession). The Federal Reserve is tightening monetary policy with a possibility of 50-basis-point (0.50%) increase occurring at one or more of the upcoming meetings. (The CME FedWatch tool currently assigns a 91% chance of a half-point rate hike occurring at next month’s meeting.) In the background of all this is Russia’s continued invasion of Ukraine and the sanctions resulting from it.
If any or all of this has you concerned about further downside volatility in stock prices, take a deep breath, grab some Tums and realize there could be big rewards for staying the course. History has shown the best days to be in the market tend to occur very close to the worst days. More importantly, if you miss those best days because you were out of the market on concern about what might happen, you will forfeit a large amount of wealth.
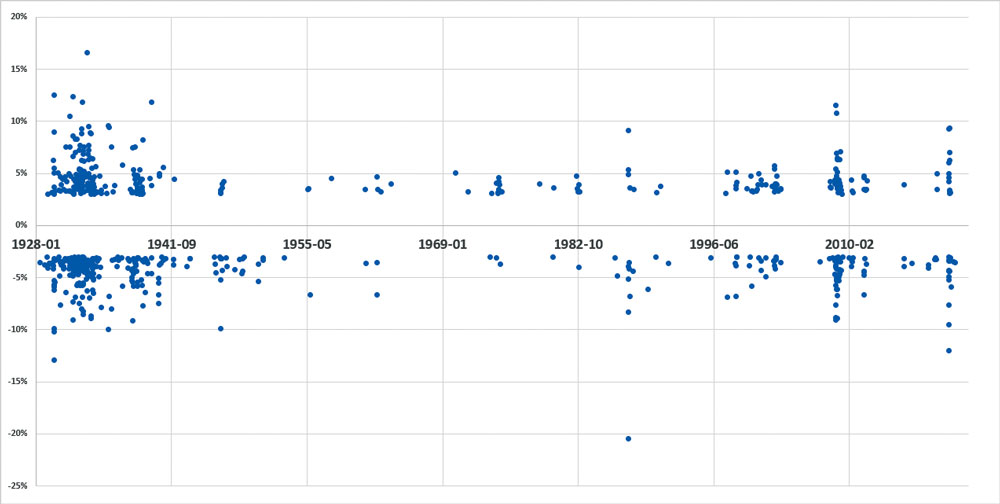
Our new Stock Superstars Report (SSR) editor Matt Markowski recently wrote about this using data Wayne Thorp compiled. Thorp isolated the “significant” up and down days in the S&P 500—those days where the S&P 500 increased or declined by 3% or more. Between January 3, 1928, and March 9, 2022, there were 294 days with an increase of 3% or more in the S&P 500 and 354 days with a decline of 3% or more out of more than 23,000 total days.
The chart below plots those significant daily moves. The horizontal axis shows the progression of time from left to right, while the vertical axis shows the magnitude of the daily price change for the index. As you can see, significant moves in the market—both to the upside and downside, tend to group together.
As Matt explained in the April SSR monthly report, “while there are the occasional articles on the benefits of missing the market’s worst days, the chart shows that to do so would mean missing out on many of the market’s best days. This is especially true since many of the biggest up days in the S&P 500 came during significant and prolonged market declines, when many investors were convinced that things were going to keep getting worse.
“If you stayed invested in the S&P 500 from the start of 1928 through March 9, 2022, you would have earned 23,987.2%. If you were out of the market for the 10 worst days over that period, you would have seen your return increase to 26,525.8%. Perhaps most surprising, though, was the impact of missing out on the 10 best days. Sitting on the sidelines for 0.04% of the days over this period would have dropped your return to 7,864.5%.”
It can be tempting to say, with the benefit of hindsight, that you simply need to miss the worst days. To miss the worst days but take advantage of the best days requires a perfect—not just a near-perfect, but a perfect—ability to the time the market because of the clustering of the best and worst days. Bluntly put, get your timing wrong and you may never recoup the wealth you’ve forfeited. This is among the reasons why we at AAII encourage investors to stay invested over the long term instead of attempting to time the market.
At the same time, ensure your allocation is the right one for you, and that your portfolio still reflects your desired allocation. Funds needed within the next few years should be invested in so-called safe assets such as savings accounts, money market funds, Treasury bills, etc. The goal is to preserve wealth. Funds not needed for at least 10 years should be aggressively invested to offset the deteriorating effects of inflation. In between, a mix of asset classes can help you find the right balance of realizing growth while keeping the volatility in your portfolio’s returns at a reasonable level.
Clustering of Days When the S&P 500 Has Moved Up or Down by at Least 3%

- Paul Merriman offers alternatives for assessing downside risk instead of looking at volatility measures such as standard deviation in the current issue of the AAII Journal.
- If the current environment has you in the mood to bargain shop, here are the traits AAII members consider when buying stocks.
- Anine Sus discusses the financial challenges millennials face on her My Investing Discoveries blog.
- Taxes are due on Monday. If you haven’t filed yet, our popular tax guide may be of help.
- With so many different types of bonds as well as other cash-equivalent instruments available to investors, how do you know where to start? The PRISM Academy is here to help you narrow down which ones you want to add to your portfolio. Complete Lesson 11 today.
“What are your thoughts about the new target withdrawal percentage in March AAII Journal article by Wade Pfau?”
Click here and then choose the Join Community button on the right to answer this question or read other responses.
AAII Sentiment Survey
The results from the latest AAII Sentiment Survey show optimism among individual investors falling to a level not seen in nearly 30 years. Meanwhile, both neutral and bearish sentiment rose.
Bullish sentiment, expectations that stock prices will rise over the next six months, decreased by 8.9 percentage points to 15.8%. This is among the 10 lowest readings in the survey’s history, which dates back to 1987. Optimism was last lower on September 4, 1992 (14.0%). Bullish sentiment is below its historical average of 38.0% for the 21st consecutive week and is at an unusually low level (below 27.9%) for the 11th time out of the last 14 weeks.
Neutral sentiment, expectations that stock prices will stay essentially unchanged over the next six months, increased 1.8 percentage points to 35.7%. This is the fourth consecutive week that neutral sentiment is above its historical average of 31.5%.
Bearish sentiment, expectations that stock prices will fall over the next six months, jumped by 7.0 percentage points to 48.4%. The increase keeps pessimism at an unusually high level for the 10th time in 13 weeks. It also keeps bearish sentiment above its historical average of 30.5% for the 20th time out of the last 21 weeks.
Historically, the S&P 500 index has gone on to realize above-average and above-median returns during the six- and 12-month periods following unusually low readings for bullish sentiment and for the bull-bear spread. (This week’s bull-bear spread of –32.6% is unusually low too.) Unusually high bearish sentiment readings historically have also been followed by above-average and above-median six-month returns in the S&P 500.
Continued high rates of inflation, the ongoing invasion of Ukraine by Russia, rising interest rates and Washington politics are influencing individual investors’ outlook for stocks. Other factors include supply chain issues, monetary policy and corporate earnings.
In this week’s special question, we asked AAII members to share what portfolio changes, if any, they made as a response to rising interest rates and bond yields. Slightly more than one-third of respondents (36%) say that they are making no changes in light of rising rates and bond yields.
Of those who are making changes, many respondents list more than one. About 23% of respondents say that they are altering their equity exposure, such as selling, buying, purchasing equity exchange-traded funds (ETFs) and more. Around 22% indicate that they are making bond changes because of the increasing rates and yields. Roughly 11% of responses say they are moving more of their portfolio into cash. Additionally, 4% of responses mention changing their overall strategy, such as moving from growth stocks to value stocks.
Here is a sampling of the responses:
- “The Federal Reserve’s interest rate increase was anticipated, so no reactionary changes.”
- “I’m purchasing stocks as the market trends down and volatility pushes stocks of interest to my target prices. I’m also purchasing bonds with higher coupon rates than current fixed-rate loans to arbitrage the difference.”
- “I have purchased Treasury I bonds as an inflation hedge, but otherwise have not adjusted the bond portion of my portfolio (yet).”
- “I’ve moved half of my portfolio to cash.”
- “I’m shifting my focus to more stable and/or passive activity on my own part, building cash, watching the charts and reducing my holdings I see signaling declines.”
Bullish: 15.8%, down 8.9 points
Neutral: 35.7%, up 1.8 points
Bearish: 48.4%, up 7.0 points
Bullish: 38.0%
Neutral: 31.5%
Bearish: 30.5%
See more Sentiment Survey results.

April 7, 2022 Five Key Investing Concepts
March 31, 2022 The Yield Curve Is Flattening, but Has Yet to Signal a Recession
March 24, 2022 Seeking a Truly Active Fund Is Not Enough
March 17, 2022 A Useful and Free Resource for Viewing Economic Trends

Discussion
Robert from MO posted over 4 years ago:
Chart label showing 2010-02 probably 2010-22?
Robert Scott from MO posted over 4 years ago:
Chart in today's letter shows 2010-02 and probably meant 2010-22?
Kirby from TX posted over 4 years ago:
Re. the post by Robert (Scott), I believe the chart label "2010-02" signifies 2010-February and, as such, the label is fine as is.
Kevin from CA posted over 4 years ago:
Never liked this “10 best days in the market” example, which I’ve seen often. I very much agree with “stay invested“ ( and keep investing) but this isn’t why. How could anyone specifically miss the 10 best days? Similar to saying “time the market so you can miss the 10 worst days”. Neither is remotely possible. Investing decisions require probability. This outcome, or anything similar, is not remotely possible. The DALBAR studies make this point far more convincingly (with high probability, since it actually happens). Not ragging on AAII since this “10 day” thing is oft-repeated by others, but it should be dropped. It’s a curiosity, nothing more in my opinion. Thanks for letting me whine.
Gary from Florida posted over 4 years ago:
As a beginning, uniformed investor I used to fret about significant drops in "the market". Although I am, by no means an expert, I do know enough to trust objective, knowledgeable folks like those who write for AAII. I also learned not only to stay invested but to look at equity purchases as if I were in the market for a new car; the price of the car drops 25%? Goody, time to buy. As long as one has sufficient cash cushion for emergency expense,s then being patient is much less stressful. I also learned that even the best of stock analysts is imperfect, so a diversified portfolio of low fee ETFs or mutual funds allows me to sleep a lot better and spend time doing what I enjoy rather than having to stare at a computer screen for hours each day.
Stephen from New York posted over 4 years ago:
The basic theme here is to stay invested and not try to time the market. Although there is not much about making good stock / investment selections in the 1st place. If you choose good quality profitable companies, or reliable instruments of debt, capitalism, if it survives, will save you and your investments. I know too many investor newbies who run at the first sign of dark clouds. Buying high and selling low. Not getting back in (or staying in) because they are ignorant of the historical investment record. A shame the 1929 market crash aura of fear still exists, especially for those who know very little about it. The financial markets are very much about the present and the future, but equal weight should be given to the history, and that's what this article is all about. It's a history lesson.
Rob from NC posted over 4 years ago:
Gary from Florida, you have the right idea. Keep doing what you’re doing for the rest of your life and you should be fine. (I would caution you to consider the relative benefits of ETFs over mutual funds, but that’s a secondary issue.) Be skeptical of what you read, even from AAII. Don’t ever let “expert” wisdom overrule your own. As always, I have to take issue with one of the author’s statements that “a mix of asset classes can help you find the right balance of realizing growth while keeping the volatility in your portfolio’s returns at a reasonable level.” If I’d listened to such advice 10 years ago, I would have less than half my current wealth. Volatility is not risk! THAT should be the main takeaway from the article above! Volatility is irrelevant to a long-term investor, and there is no reason not to remain a long-term investor even after retirement. All the articles discussing “sequence risk” seem to miss a critical element—the ability to reduce one’s expenses in response to a down market. If you keep your fixed expenses low, thereby allowing flexibility in your overall expenses, you can remain 100% invested in equities for the rest of your life. Flexibility in expenses, coupled with the general rule to always live well below your means, makes for a happy retirement. At least it has for me.
You need to log in as a registered AAII user before commenting.
Create an account