

The Yield Curve Is Flattening, but Has Yet to Signal a Recession
by Charles Rotblut | March 31, 2022
The yield curve made headlines on Tuesday when it briefly inverted. The 10-year Treasury note’s yield dipped below the two-year note’s yield at 2.39% on an intraday basis. The 10-year note ended the day with a yield that was six basis points higher than the two-year note’s yield (2.41% versus 2.35%).
Inverted yield curves occur when bonds with shorter maturities trade at yields that are higher than those for bonds with longer maturities. Traders are willing to accept lower relative yields on longer-maturity bonds if they think interest rates will fall in the future because of weaker economic conditions.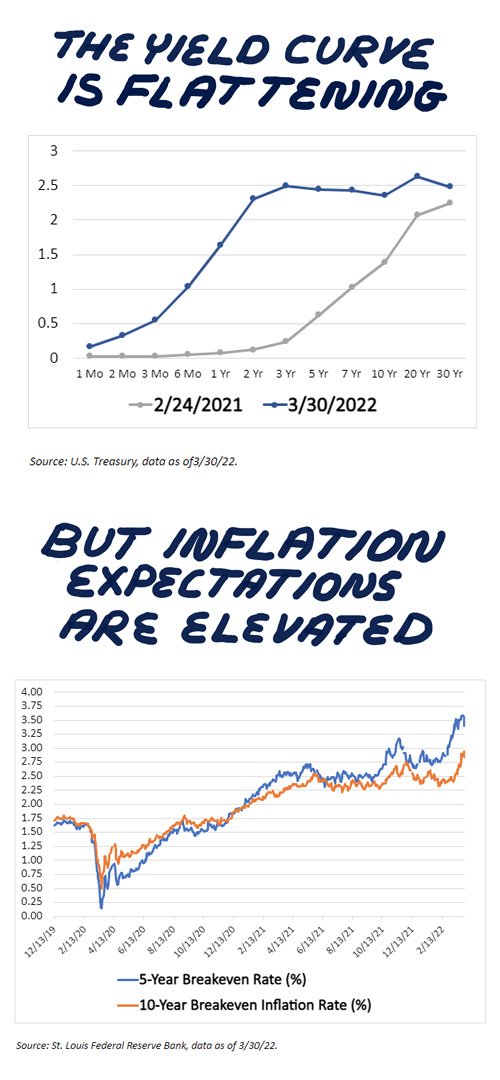
This is why inverted yield curves have a reputation for being harbingers of recessions. Prior to the 2020 recession, the average length of time between an inversion occurring and a recession starting was 11 months. There is much variance around this number, however. A 2018 Federal Reserve study found that the lead time between a yield curve inverting and a recession starting ranged from six to 24 months.
How yield curve inversion is measured matters. Duke professor Campbell Harvey, who first documented inverted yield curves as a recession indicator, contrasted the yield on the three-month Treasury bill with the yield on the five-year and 10-year notes. He told us in a 2019 interview that he looks “for the average of the yield curve slope over the quarter to be negative.” On this basis, the yield curve has yet to signal that a recession is occurring despite all the attention paid to it on Tuesday.
The yield curve is flattening though, as you can plainly see. I included the yield curve from February 2021 to provide some contrast. The yield curve was steepening then as bond traders were expecting economic growth to occur when the first coronavirus vaccines were given.
Now, we have second booster shots being suggested for certain populations, high oil prices and the Federal Reserve attempting to do a “soft landing.” High energy costs have preceded many of the past recessions. A report recently published by investment bank Piper Sandler argued that the Fed has accomplished “only one true soft landing versus eight recessions” during the past 60 years. (The record improves to 1-7 if the coronavirus recession is excluded.)
An ongoing challenge for Fed chair Jerome Powell and the rest of the Federal Open Market Committee (FOMC) is inflation. It hasn’t been as transitory as they previously hoped. Some of this is due to ongoing supply chain issues. (Even the cost of printing the AAII Journal is being driven up by supply chain issues.) Part of it, however, is due to expectations. It doesn’t take any knowledge of economics to understand which direction prices have been moving in. Breakeven rates, shown in the second chart, signal what traders expect the rate of inflation to be over the next five and 10 years.
None of this guarantees that a recession is coming. The Atlanta Fed’s GDPNow estimates first-quarter economic growth to be 1.3%. Not high, but still positive. An easing of supply chain issues—which is expected to occur this year—combined with more oil production would help to ease inflationary pressures. FOMC members, who are aware of the historical record, may avoid overshooting on rate hikes.
To the extent that the financial markets are efficient, prices and yields should reflect prevailing expectations about where the economy is headed. We’re seeing uncertainty being priced in by the bond market via yield curves as well as by the major stock indexes, which remain below their record highs. Spot prices in the commodity markets remain high because of demand and not enough supply (including the impact of Russia being rightfully sanctioned).
Is the market sometimes wrong? Absolutely. But then you must have the foresight to know in what way, by how much and by what amount of time. Many people have forfeited a large amount of wealth by being overconfident in their ability to predict what is going to happen. This is why we encourage individual investors to invest with a long-term view while, at the same time, ensuring that your allocation also accounts for any shorter-term withdrawals that may be needed.

- Here’s the interview where Campbell Harvey explained the inverted yield curve’s role as an indicator of a forthcoming recession.
- Periodic, threshold-based rebalancing has enhanced my ability to psychologically cope with periods of uncertainty and down markets. I demonstrate how rebalancing can also be beneficial to those who are taking withdrawals in the March AAII Journal.
- AAII assistant editor Anine Sus talks about her experience of opening high-yield savings accounts and why she chose to open two instead of just one in her latest My Investing Discoveries blog post.
- Our next Individual Investor Show will air on Thursday. Craig Israelsen and Paul Merriman will be joining us. You can subscribe via our YouTube page or via your favorite podcast app (including Apple Podcasts).
- Finding the right stock for your portfolio doesn’t have to be difficult. We’ve compiled a checklist of every AAII resource we offer on our website for stock investors to utilize. We challenge members to use these resources to find a few new stock opportunities and share their experience with other PRISM students. Complete Lesson 6 today.
“Have you considered owning I bonds to hedge against inflation?”
Click here and then choose the Join Community button on the right to answer this question or read other responses.
AAII Sentiment Survey
The results from the latest AAII Sentiment Survey show a sharp increase in the percentage of individual investors who describe their outlook for stocks as “neutral.” In addition, pessimism plunged while optimism only slightly declined.
Bullish sentiment, expectations that stock prices will rise over the next six months, decreased by 0.9 percentage points to 31.9%. Optimism remains below its historical average of 38.0% for the 19th consecutive week.
Neutral sentiment, expectations that stock prices will stay essentially unchanged over the next six months, surged 8.8 percentage points to 40.6%. Neutral sentiment was last higher on January 1, 2020 (40.9%). The historical average is 31.5%.
Bearish sentiment, expectations that stock prices will fall over the next six months, fell 7.9 percentage points to 27.5%. Pessimism was last lower on November 18, 2021 (27.2%). The drop ends an 18-consecutive-week streak of readings above the historical average of 30.5%.
Neutral sentiment is now at an unusually high level. The dividing line between typical and unusually high levels is 39.8%. Historically, unusually high neutral sentiment readings have been followed by slightly below-average and below-median six-month returns for the S&P 500 index. However, the majority of past unusually high neutral sentiment readings were recorded during the so-called lost decade of 2000–2009.
Both bullish and bearish sentiment are currently within their typical ranges.
The ongoing invasion of Ukraine by Russia, stock market volatility, inflation, interest rates, the coronavirus pandemic and politics are all influencing individual investors’ outlook for stocks. Other factors include the economy and corporate earnings.
This week’s special question asked AAII members to share their thoughts on the current valuation of stocks. Slightly more than half of all respondents (51%) feel that stocks are overvalued and that many investors are being too optimistic. In contrast, 20% of respondents say that they feel stocks are fairly valued given economic and global circumstances. Around 16% have a mixed outlook. These respondents say certain kinds of stocks, such as growth stocks, are overvalued while others, like value stocks, are undervalued. Just 5% of respondents see stocks as currently being undervalued.
Here is a sampling of the responses:
- “The market is still overvalued.”
- “Fairly priced as we wait to see if the economy moves lower as the world economy becomes more difficult to operate in or if it moves higher as supply chain kinks are worked out with minimal impact to profits.”
- “Many big-name stocks are overvalued, while many lesser-known stocks are good deals.”
- “Stocks are cheap relative to bonds.”
Bullish: 31.9%, down 0.9 points
Neutral: 40.6%, up 8.8 points
Bearish: 27.5%, down 7.9 points
Bullish: 38.0%
Neutral: 31.5%
Bearish: 30.5%
See more Sentiment Survey results.

March 24, 2022 Seeking a Truly Active Fund Is Not Enough
March 17, 2022 A Useful and Free Resource for Viewing Economic Trends
March 10, 2022 Key Considerations When Adding Commodities to Your Portfolio
March 3, 2022 Warren Buffett's Comments on Allocation

Discussion
John L from NJ posted over 4 years ago:
Banks are profit seeking organizations that borrow at short term rates and loan at long term rates. The difference between long and short rates is a banks gross margin. Yield curve inversion causes recessions because banks stop lending and may refuse to roll over existing company loans when their gross margin is very low or negative. Banks don't borrow at the 2 year rate and lend at the 10 year rate. Bank borrowing is much shorter than the 2 year rate. Effectively they borrow at the fed funds rate. That is why Professor Campbell Harvey measures the difference between 3 month and 5 and 10 year rates as an indicator of future recessions.
Barry J from TX posted over 4 years ago:
Thank you, John, for your insights into the role of bankers – in addition to commercial bond markets -- in foreshadowing -- and causing -- recessions. The third leg to this wobbly (investor milking?) stool is government monetary (spending & taxing) policy (aka “the budget”). The milkmaid in chief, the Fed FOMC, has a pitifully consistent history for ALWAYS being “behind the yield curves” (there is more than one yield curve) when adjusting their overnight (very short term) lending rates (using the drive thru lane aka “Fed window” only bankers can access) and/or reducing/increasing the nominal interest rates (the ones that get all the breathless news coverage). All of these rate decisions are “expected” by the bond markets and are anticipated (or “priced into”) market prices. By the time us “IIs” see this information published to the public, the markets have already adjusted, and the suit and tie “Willie Suttons” have already positioned themselves to commandeer a “getaway driver” to flee the scene of the crime. That would be us, the “late to the party” individual investors, or “IIs.” Thus, the key sentence in this article is “To the extent that the financial markets are efficient, prices and yields should reflect prevailing expectations about where the economy is headed.” Markets ARE “efficient” as Fama et al have debated since 1952. However, markets are NOT equally “efficient” for all participants. That is why the behavior of some market participant – the ones spotlighted above --are labelled as “frontrunning.” Guess who the runners in the pack BEHIND these nice folks are? As a famous cartoon opossum first said in 1970, “We have met the enemy and he is us.” Happy April Fools’ Day, ya’ll all.
You need to log in as a registered AAII user before commenting.
Create an account