

Small-Cap Stocks Are Cheaper; Not So Much for Large-Cap Stocks
by Charles Rotblut | June 02, 2022
In his May Model Shadow Stock Portfolio Update, John Bajkowski looked at the current valuations, returns and earnings estimate revisions for a cross-section of the market. I thought it would be interesting to look at the valuations from a different perspective: How current levels compare to those of the not-too-distant past.
The median price-earnings (P/E) ratio for stocks held within the S&P 500 index is 22.6. The median price-to-book-value (P/B) ratio is 3.65, while the median price-to-sales (P/S) ratio is 3.13. None of these ratios are cheap on an absolute basis. (All data is as of May 31, 2022.)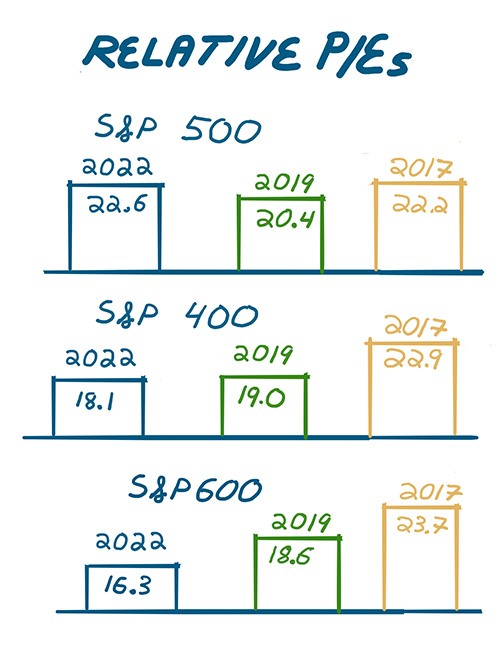
Though it may surprise you given this year’s downward move in the market, current valuations for large-cap stocks are still generally more expensive than they were three and five years ago:
- May 2022—median P/E: 22.6; median P/B: 3.65; median P/S: 3.13
- May 2019—median P/E: 20.4; median P/B: 3.03; median P/S: 2.52
- May 2017—median P/E: 22.2; median P/B: 3.24; median P/S: 3.24
It is a mixed story for S&P MidCap 400 index stocks. They currently trade at a comparatively more attractive price-earnings ratio. The median price-to-book ratio is well above where it was in 2019 but close to the 2017 level. The current median price-to-sales ratio of 2.13 is noticeably more expensive than it has been over the past few years. All three valuation ratios are below those of the S&P 500, however.
- May 2022—median P/E: 18.1; median P/B: 2.62; median P/S: 2.13
- May 2019—median P/E: 19.0; median P/B: 2.14; median P/S: 1.76
- May 2017—median P/E: 22.9; median P/B: 2.46; median P/S: 1.88
Where we really see lower valuations in relation to large-cap stocks currently is among S&P SmallCap 600 index stocks. On a price-earnings basis, these stocks also appear cheaper relative to recent history.
- May 2022—median P/E: 16.3; median P/B: 1.85; median P/S: 1.46
- May 2019—median P/E: 18.6; median P/B: 1.68; median P/S: 1.30
- May 2017—median P/E: 23.7; median P/B: 2.06; median P/S: 1.49
The combined three indexes only account for about one-quarter of all exchange-traded stocks. So, let’s look at the universe of all exchange-traded stocks:
- May 2022—median P/E: 17.8; median P/B: 1.59; median P/S: 2.29
- May 2019—median P/E: 17.6; median P/B: 1.80; median P/S: 1.94
- May 2017—median P/E: 21.4; median P/B: 1.98; median P/S: 2.10
Notably, valuations based on the price-earnings ratio and price-to-sales ratio are higher for the exchange-listed stocks group compared to the S&P SmallCap 600 group. The reason can be partially attributed to the former group being much larger in terms of the number of stocks. The all exchange-listed stocks group currently contains a starting universe of 6,000 stocks versus 600 for the S&P SmallCap 600. (The majority of stocks in the all exchange-listed group are too small for inclusion in the aforementioned S&P indexes, though the stocks held by those indexes are part of the all exchange-listed group.) Though the comparisons do vary by which ratio is looked at, there is generally a decrease in valuations relative to market size.
None of the current valuations are cheap on an absolute basis. We do continue to see cheaper valuations for the smaller-size companies. Value investors seeking ponds to fish in may want to consider looking among such stocks.

- While the price-earnings ratio is often looked at in isolation as a valuation indicator, it works better when combined with other valuation ratios. This is what we do with the A+ Investor Value Grade.
- The June AAII Journal is now online!
- In the new issue, you can find ideas for both high-yielding dividend stocks and stocks with the strongest dividend growth rates.
- The newest episode of the Individual Investor Show focuses on how inflation impacts investing in retirement. You can watch it on YouTube or listen to it on your favorite podcast provider, including Apple Podcasts.
AAII Sentiment Survey
Optimism jumped and pessimism plunged in the latest AAII Sentiment Survey. The large changes moved both indicators back to well within their typical historical ranges.
Bullish sentiment, expectations that stock prices will rise over the next six months, rebounded by 12.2% to 32.0%. This is the highest level of optimism recorded since March 24, 2022 (32.8%). Even with the big increase, bullish sentiment remains below its historical average of 38.0% for the 28th consecutive week.
Neutral sentiment, expectations that stock prices will stay essentially unchanged over the next six months, rose 4.3 percentage points to 30.9%. Neutral sentiment is below its historical average of 31.5% for the sixth consecutive week.
Bearish sentiment, expectations that stock prices will fall over the next six months, fell 16.4 percentage points to 37.1%. Pessimism was last lower on March 31, 2022 (27.5%). Bearish sentiment is above its historical average of 30.5% for the 27th time out of the past 28 weeks.
As noted above, this week’s changes put both bullish and bearish sentiment back within their typical historical ranges.
A rebound from the recent market lows has likely helped to calm the nerves of many individual investors, though concerns about ongoing stock market volatility, inflation, interest rates, the coronavirus pandemic and politics are still influencing sentiment. Also having an impact is the ongoing invasion of Ukraine by Russia, stock market volatility, the economy and corporate earnings.
Bullish: 32.0%, up 12.2 points
Neutral: 30.9%, up 4.3 points
Bearish: 37.1%, down 16.4 points
Bullish: 38.0%
Neutral: 31.5%
Bearish: 30.5%
See more Sentiment Survey results.

AAII Asset Allocation Survey
Individual investors’ allocations to equities fell to their lowest level since late 2020 last month. The May AAII Asset Allocation Survey also shows cash levels rising to their highest level in nearly a year.
Stock and stock fund allocations declined 2.7 percentage points to 67.1%. This was the smallest exposure to equities since November 2020 (63.2%). However, the decrease was not small enough to keep equity allocations from staying above their historical average of 61.0% for the 24th consecutive month.
Bond and bond fund allocations rebounded by 1.2 percentage points to 13.8%. Fixed-income exposure fluctuated within an 0.4-percentage-point range for the fourth consecutive month. Bond and fund allocations are also below their historical average of 16.0% for the 15th consecutive month.
Cash allocations increased by 1.5 percentage points to 19.1%. Cash exposure was last higher in July 2020 (19.9%). Even with the increase, May was the 25th consecutive month that cash allocations have been below their historical average of 23.0%.
Because the survey is conducted throughout the month, some AAII members responded as the stock market was trading at or near its recent lows.
Optimism in our weekly Sentiment Survey stayed at unusually low levels throughout May. Sentiment does not always result in altered allocations as many AAII members follow a long-term approach to investing.
- Stocks and Stock Funds: 67.1%, down 2.7 percentage points
- Bonds and Bond Funds: 13.8%, up 1.2 percentage points
- Cash: 19.1%, up 1.5 percentage points
- Stocks: 31.2%, down 2.0 percentage points
- Stocks Funds: 35.9%, down 0.6 percentage points
- Bonds: 3.0%, up 0.2 percentage points
- Bond Funds: 10.7%, up 0.9 percentage points
- Stocks/Stock Funds: 62.0%
- Bonds/Bond Funds: 16.0%
- Cash: 22.0%
Take the Asset Allocation Survey.
May 26, 2022 Suggestions for Customizing the 60/40 Portfolio (and Other Allocations)
May 19, 2022 Guidelines for Contrarian Investors Going Bargain Hunting
May 12, 2022 A Playbook for When the Stock and Bond Markets Are Down
May 5, 2022 Don't Abandon Diversification Because of This Year's Rough Patch

Discussion
Barry J from TX posted over 4 years ago:
Lots of data points here with lots of "noise" (as DK would say). Makes you remember how good the pre-election 2019 economy was. Only 2 of 27 data are favorable in 2022 -- and that is after a 5-month market down 16% YTD. Oddly enough, the only 2022 favorable P/Es are favorable by 16%. When you factor in the inherent higher risk (and volatility) in small caps in general, and the fact that they are facing rising costs of capital due to the rising FFR and Fed bond sales shrinking M2 (the amount of money available), this "edge" does not seem to cover the risks.
John L from NJ posted over 4 years ago:
If this is the beginning of a bear market; small caps should be cheap. They will fall the most during the last third of a bear market. Some small caps would struggle to survive a recession. Banks will not be eager to extend credit to small companies with thin margins during a period of financial stress. The best time to own small cap historically is after the market bottoms. Big growth will fall less if this is the beginning of a bear. And if this is a correction, big growth will lead the recovery. You might have noticed that on up days recently; growth is more likely to lead. Sometimes a bargain is a sucker trap. Save yourself the stress; buy and hold an index fund and forget market and sector timing.
You need to log in as a registered AAII user before commenting.
Create an account