

The Large-Cap Equity Premium Has Become Less Persistent
by Charles Rotblut | August 25, 2022
The long-term large-cap equity premium—the excess return of stocks over bonds—has been less persistent than many think. This was an argument put forth by Michael Finke, a professor at The American College of Financial Services, in the Advisor Perspectives newsletter.
Finke compared 20-year returns for the S&P 500 index, long-term government bonds, long-term corporate bonds, intermediate corporate bonds and cash. Though the equity premium existed during most rolling periods, there were several 20-year periods when bonds fared better.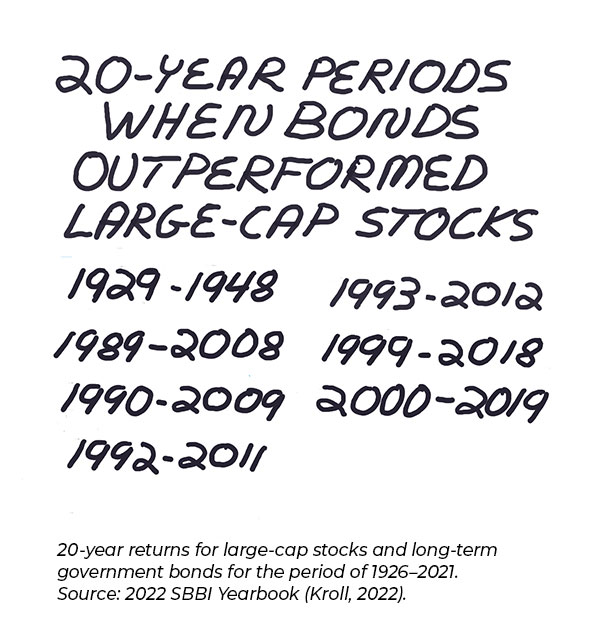
The findings were based on the Stocks, Bonds, Bills, and Inflation (SBBI) monthly data set. Since we have access to the same data, I decided to rerun the numbers. The data set includes 77 rolling periods representing spans of 20 consecutive calendar years between 1926 and 2021. Of these 77 periods, long-term Treasury bonds outperformed large-cap stocks seven times—about 9% of all rolling periods. Long-term corporate bonds outperformed large-cap stocks 10 times (13%).
Perhaps more notable is what’s happened in more recent times. Six of the seven 20-year periods when long-term government bonds outperformed stocks ended between 2008 and 2019. Long-term corporate bonds fared better than large-cap stocks during seven out the 14 rolling 20-year periods ending between 2008 and 2021.
Dates matter here. The 20-year period ended in 2008 started in 1989. The 20-year period ended in 2019 started in 2000. Both periods were marked by the dot-com crash, the financial crisis and falling interest rates. The gains in large-cap stocks ($1 turned into $5.04 and $3.24 in the periods ending in 2008 and 2019, respectively) were less than the gains realized by long-term government bonds ($1 turned into $6.76 and $3.96, respectively). An investment in long-term corporate bonds turned $1 into $5.26 and $4.53, respectively, over the same periods.
Finke makes the argument that the equity premium is neither stable nor guaranteed. Over shorter periods—especially those under five years—there have been many times when bonds or even Treasury bills have outperformed stocks. This is why more conservative allocations are suggested for shorter-term goals, something we discuss in the PRISM Academy.
When we look at long investing periods, it becomes easier to see the nuances in the long-term persistency of the equity premium. The equity premium has existed during most 20-year rolling periods ending between 1945 and 1999. It has not been persistent during the 20-year rolling periods ending after 2000.
Notably absent from Finke’s analysis were small-cap stocks. Small-cap stocks realized higher returns than corporate bonds during all 20-year rolling periods analyzed. Long-term Treasury bonds only outperformed small-cap stocks once: the period from 1989 through 2008. A dollar invested solely in small-cap stocks in 1989 turned into $6.46 at end of 2008, slightly below the $6.76 realized by a dollar invested in long-term government bonds.
The so-called size premium—the extra return from investing in small-cap stocks instead of large-cap stocks—has resulted in what can be described as a small-cap equity premium (excess returns of small-cap stocks versus bonds). This is a long-term premium that justifies the consideration of maintaining an allocation to small-cap stocks for those with longer investing horizons.

- This is not the first time the equity premium has been questioned. In the October 2002 AAII Journal, we published an article discussing the “shrinking equity premium.”
- We continue to think investors will maximize their returns by choosing an allocation appropriate for their goals and tolerance for risk.
- If you are including an allocation to cryptocurrencies as an alternative to stocks and bonds, be aware that where you trade and store your cryptocurrency matters.
Members are looking for your input. Can you help with this question from the Options Investing Strategies Community?
“The WSJ recently reported that one of the most-traded options contracts in the market today is a bullish option on Bed Bath & Beyond (BBBY) stock. Any thoughts on this specific security or what you’ve heard recently about its position?”
Tap the button and then choose the Join the Community button on the right to answer this question in the AAII Community.
Answer This Question in the AAII Community »
AAII Sentiment Survey
The results from the latest AAII Sentiment Survey show optimism about the short-term direction of the stock market falling to its lowest level for the month of August. At the same time, pessimism rose back to an unusually high level.
Bullish sentiment, expectations that stock prices will rise over the next six months, fell 5.6 percentage points to 27.7%. The pullback puts optimism right at the breakpoint between typical and unusually low readings. Bullish sentiment remains below its historical average of 38.0% for the 40th consecutive week.
Neutral sentiment, expectations that stock prices will stay essentially unchanged over the next six months, increased 0.4 percentage points to 29.9%. Neutral sentiment is below its historical average of 31.5% for the 16th time in 18 weeks.
Bearish sentiment, expectations that stock prices will fall over the next six months, rose 5.2 percentage points to 42.4%. Bearish sentiment is above its historical average of 30.5% for the 39th time out of the past 40 weeks and is at an unusually high level for the 24th time out of the last 32 weeks. The breakpoint between typical and unusually high readings is currently 40.5%.
The bull-bear spread (bullish minus bearish sentiment) is –14.7% and is unusually low for the 25th time in 31 weeks. The breakpoint between typical and unusually low readings is currently –10.9%.
Historically, the S&P 500 index has gone on to realize above-average and above-median returns during the six- and 12-month periods following unusually low readings for the bull-bear spread.
Continued volatility in the major stock indexes along with inflation, corporate earnings and increased chatter about the possibility of a recession are all likely weighing on individual investors’ short-term expectations for the stock market. Also influencing sentiment are monetary policy, the coronavirus pandemic, politics and the ongoing invasion of Ukraine by Russia.
Bullish: 27.7%, down 5.6 points
Neutral: 29.9%, up 0.4 points
Bearish: 42.4%, up 5.2 points
Bullish: 38.0%
Neutral: 31.5%
Bearish: 30.5%
See more Sentiment Survey results.

August 18, 2022 Growth Stocks Are Being Helped by Inflation Expectations
August 11, 2022 Some Thoughts on the New Buyback Tax
August 4, 2022 Mutual Fund and ETF Investors Continue to Lower Their Returns
July 28, 2022 Fed Rate Hikes and Economic Hard Landings

Discussion
Hugh from WA posted over 4 years ago:
I think this mostly another way to say that equities have greater volatility than bonds. Drama is enhanced by boiling it down to simply better/worse. "The gains in large-cap stocks ($1 turned into $5.04 and $3.24 in the periods ending in 2008 and 2019, respectively) were less than the gains realized by long-term government bonds ($1 turned into $6.76 and $3.96, respectively). An investment in long-term corporate bonds turned $1 into $5.26 and $4.53, respectively, over the same periods." This is illuminating - all three choices provided multi-fold return on investment. Even if you were not clever enough to time the optimum allocation, you still made progress toward your financial goals. Hey, Charles, you've got the spreadsheet - does the "2000 - 2008 bond premium" persist with longer averaging periods?
Barry J from TX posted over 4 years ago:
Equity premiums (EP) have always been a puzzle. The EP backstory brings the importance of Charles’ prescient article into the foreground. EP “explains” why anyone would risk their money by investing in “risky” equities – like large-cap equities – when they always have the option of investing in a “risk free” asset -- like long term government bonds. This single choice points to possible explanations. In 1997 research by Jeremy Siegal of Wharton and Dick Thaler of Chicago Booth suggested that behavioral biases favoring “risky” behaviors – like overconfidence, illusions of self-control, hindsight, herding , etc. -- were potential reasons for EPs. However, other behavioral biases operate in favor of “safer” behaviors – status quo preference, loss aversion, regret aversion, endowment effect. You may have observed some of these biases playing out in AAII member comments as “reasons” for their “edge” for investing success or for preferences for the specific investment gurus they seek to emulate. Charles observed that recent market troughs in 2000 and 2008 may account for the differences in Finke’s data. This seems to support the argument that behavioral responses to “strong” market signals as a potential explanation for the change in historical equity premium rates. There is another issue with the behavioral biases argument. The comments we see have a survivorship bias aspect. We hear the stories of successful investors disproportionally. That may be a testimony to the type of people AAII attracts and retains when we KNOW there have to be just as many unsuccessful investors out there. Thanks Charles, for bring forth data to help us understand our investing behaviors better.
vic smyth from illinois posted over 4 years ago:
What is very surprising to me is if you track a 50%-50% portfolio of stocks and govt bonds using, for example, EFTs spy and tlt or iwm and edv, and rebalance when it reaches 55%-45%, how often this strategy will beat 'buy and hold' of either stocks or bonds. Also gives a good indication of when stocks are cheap relative to bonds for anyone who wants to dabble in market timing. Of course this year both have gotten clobbered as a 40-year bull market in bonds seems to be over. So, as they say, "Past performance is no guarantee of future results".
John L from NJ posted over 4 years ago:
In those 92 years there were 7 twenty year periods or 10% (72 20 year periods) when bonds outperformed stocks. 90% of twenty year periods; bonds did worse. So do you want to bet on bonds or equities having better returns for the next 20 years?
You need to log in as a registered AAII user before commenting.
Create an account