

Fed Rate Hikes and Economic Hard Landings
by Charles Rotblut | July 28, 2022
The Federal Open Market Committee (FOMC) hiked its target federal funds rate by 75 basis points (bps) yesterday. This second consecutive triple-quarter-point (0.75%) rate hike was widely expected. A 50-basis-point rate hike is currently expected to be announced at the September meeting, according to the CME’s FedWatch tool.
A bigger question than the magnitude of future monetary policy actions is what effect this tightening cycle will have on the economy. Rate hikes have a delayed impact from the time they are made, but they do contribute to economic slowdowns—which is what they are designed to do.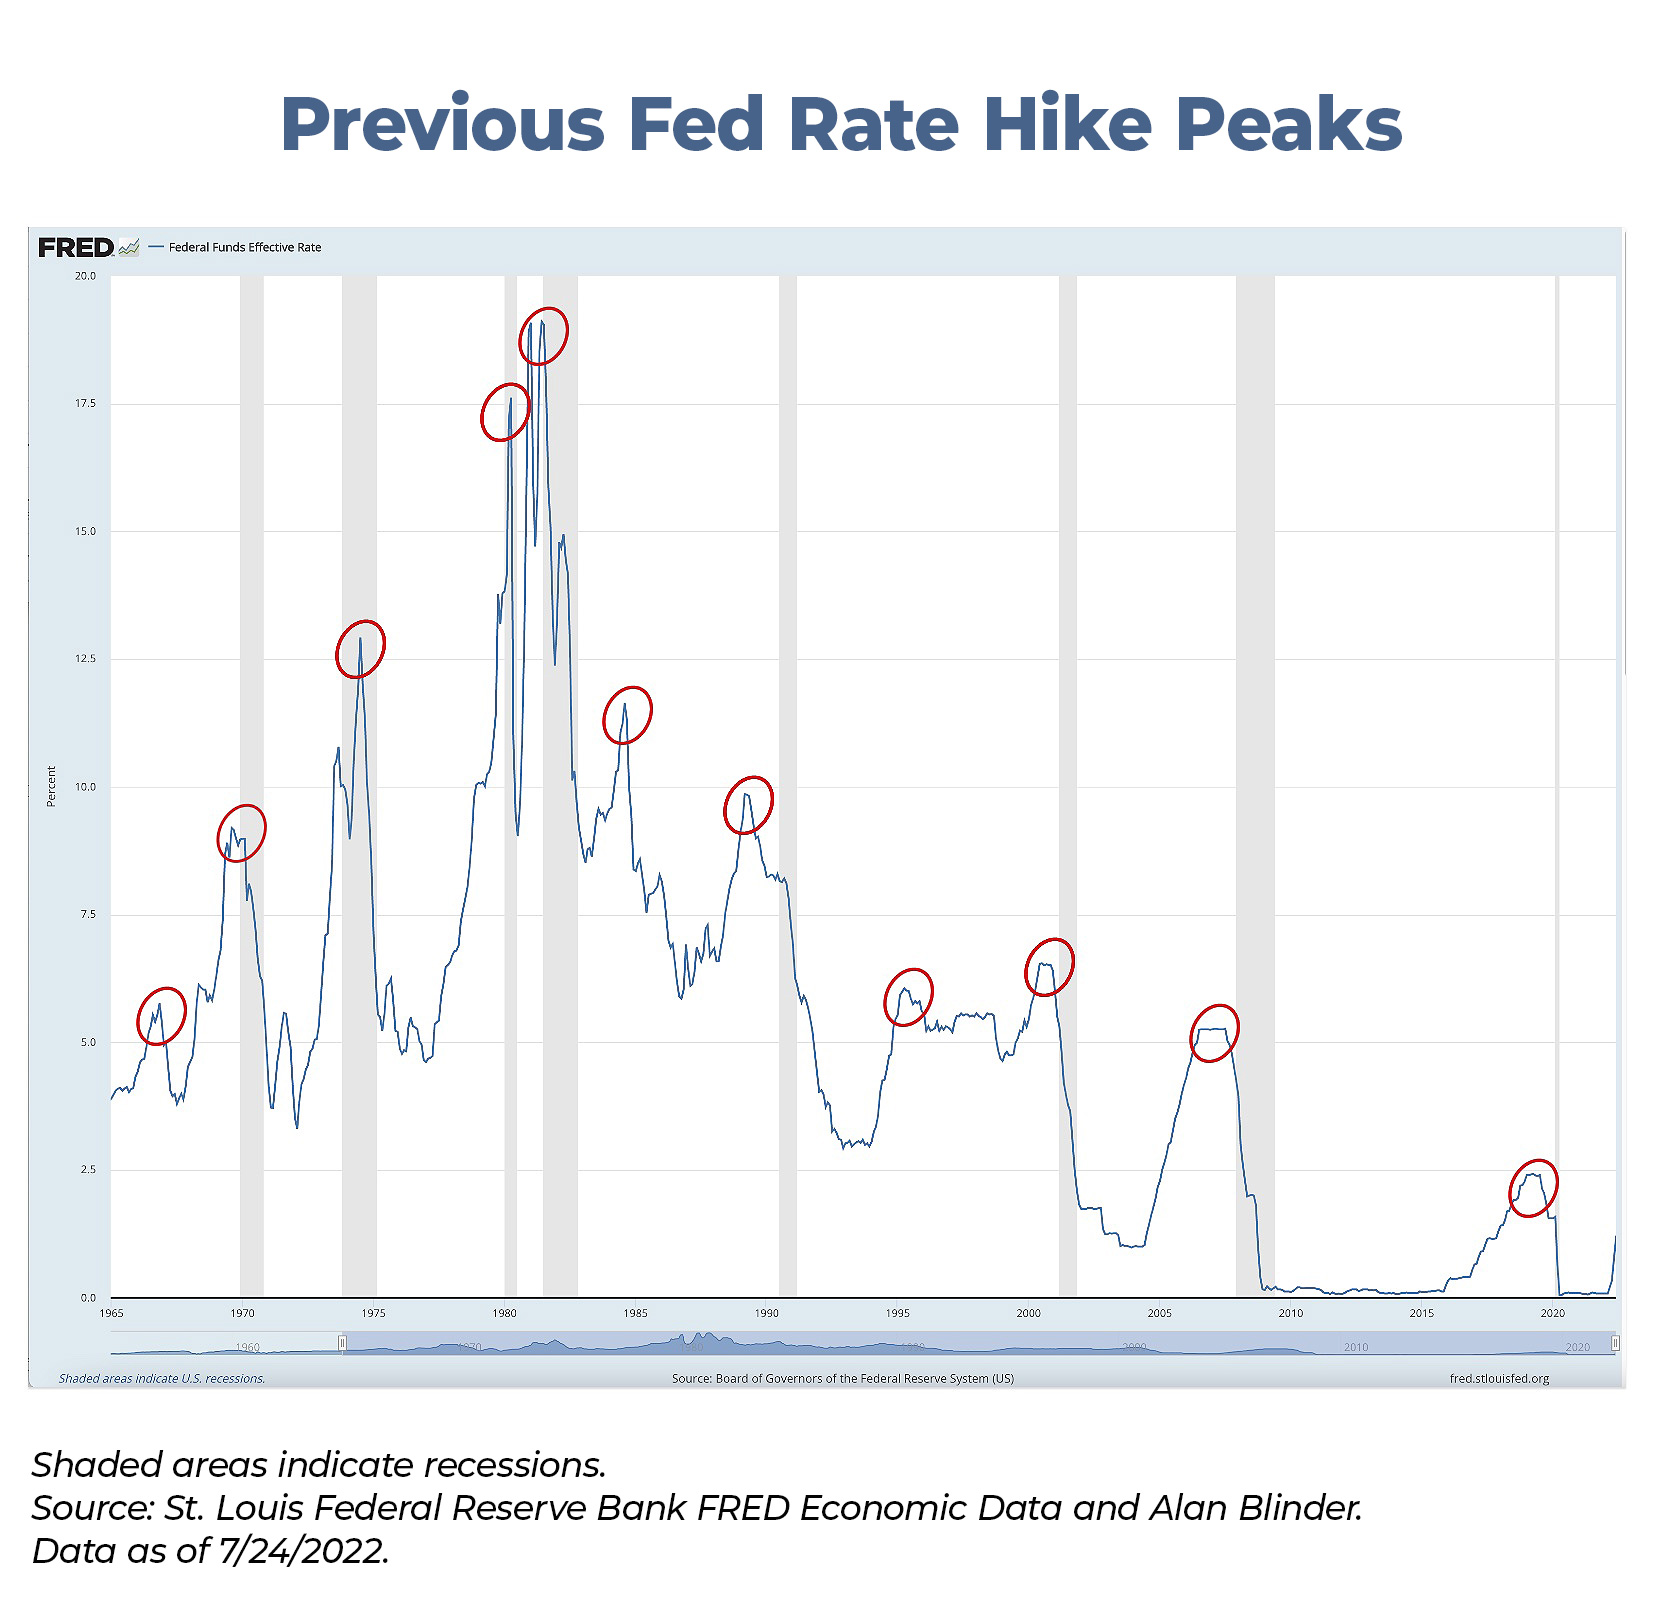
Slower economic growth lessens inflationary pressure by reducing demand for goods and services. Ideally, the Federal Reserve will be able to slow economic growth just enough to bring down inflation but not send the economy into a recession. This scenario is the so-called soft landing.
Unfortunately, most prior rate-hike cycles have been followed by recessions, so-called hard landings. This week’s chart—from FRED, the St. Louis Federal Reserve’s economic database—shows this. The shaded columns are periods when recessions have occurred. The time span and the annotations chosen are based on a February 2022 presentation by economist and former Federal Reserve vice chairman Alan Blinder.
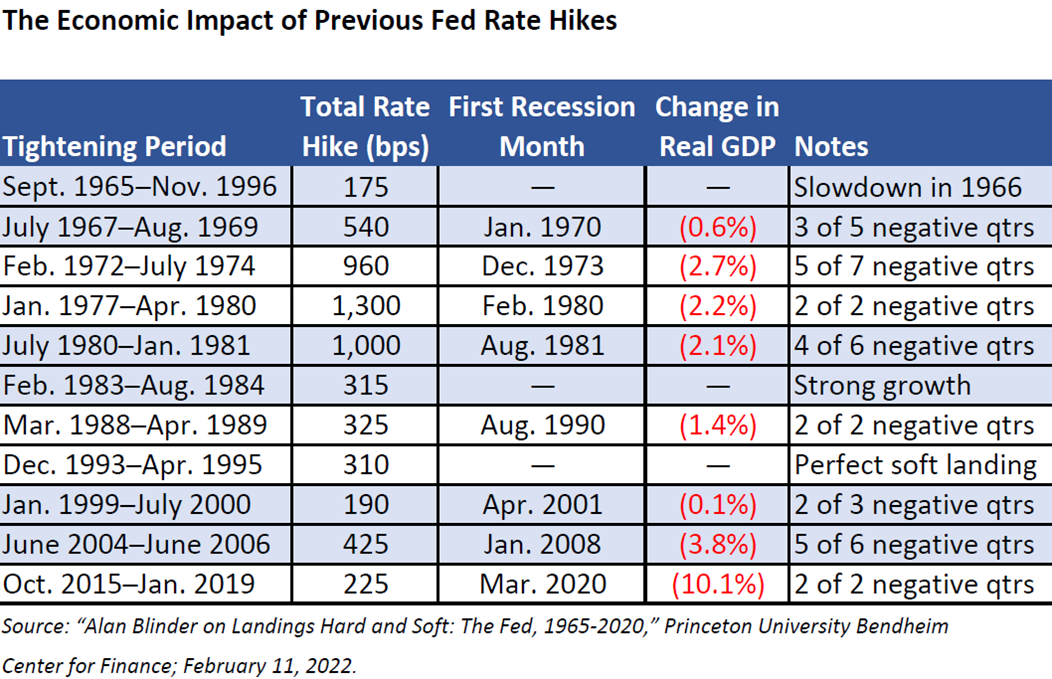
Only one of the 11 previous rate tightening cycles has resulted in what Blinder described as a “perfect soft landing.” This was the 310-basis-point tightening cycle that occurred between December 1993 and April 1995. Gross domestic product (GDP), according to Blinder, slowed from about 4.5% to 1.3% before rebounding.
The Fed did raise rates by a similar amount, 315 bps, in 1983 and 1984 without much impact on the economy. Whether it counts as a tightening cycle is up to debate. Blinder, for his part, described it as a “readjustment.”
The other nine rate-hike cycles were followed by so-called hard landings. If we set aside the coronavirus shutdown of 2020, there were only two periods where the landing was hard enough for the economy to contract by more than 2.5% on a real (inflation-adjusted) basis.
Real GDP contracted by 2.7% following the 1972–1974 rate-hike cycle. Interest rates were raised by 960 bps over that period. There had also been a sharp rise in food prices, the oil embargo by the Organization of the Petroleum Exporting Countries (OPEC), President Richard Nixon’s price controls and the Fed’s slowness in responding to rising inflation at the time.
During the Great Recession of 2007–2009, real GDP plunged by 3.8%. The severe economic downturn was preceded by the June 2004–June 2006 rate-hike cycle. Interest rates had been raised by 425 bps during that tightening cycle. There were also record high oil prices that preceded the recession. The bursting of the housing bubble and the coincident near collapse of the financial system intensified the severity of the downturn.
Six rate tightening cycles were followed by contractions of 2.2% (the 1977–1980 tightening cycle) or less. The 1965–1966 rate tightening cycle was followed by a period with real GDP remaining essentially unchanged, though Blinder says there was “a slowdown in 1966.” To the extent these are “less hard” landings or “not so hard” landings is a debate I’ll leave to the economists. They certainly felt like hard landings to anyone who lost a job or incurred other financial difficulties during those contractions.
Even if we set aside the discussion about hard versus soft landings, the lack of a clear correlation between the cumulative amount that interest rates were raised and the severity of the economic contraction that followed is worth noting. The Fed raised rates by 540 bps between 1967 and 1969 but real GDP fell by just 0.6%. The 425-basis-point rate hike in the mid-2000s was followed by a 3.8% contraction, as previously noted.
The FOMC has raised rates by a cumulative 225 bps during this tightening cycle, so far. There are signs of a slowing economy—rising initial jobless claims, a weakening housing market, a worsening index of leading indicators, the –0.9% decline in second-quarter GDP, etc.—but it’s still early. The best forecasters in the world cannot accurately predict whether the Fed will pull off a soft landing, a not-so-hard landing or a truly hard landing. It is a story that remains to be told.

- AAII contributing editor Brian Haughey shared his list of key economic data to pay attention to in the November 2020 AAII Journal.
- Technology stocks, though down considerably during the current bear market, have outperformed during past rate-hike cycles. In the current issue of the AAII Journal, we look at some cybersecurity stocks and ETFs.
- We’re in the midst of earnings season and many companies are reporting surprises. Not all earnings surprises are the same as AAII president John Bajkowski explains.
Members are looking for your input. Can you help with this question from the Mutual Funds & ETFs Community?
“The cybersecurity industry is projected to reach $500 billion by 2030, registering a compound annual growth rate (CAGR) of 12.0% from 2022 to 2030. How are people allocated to this specific industry and what do you see in its future?”
Tap the button and then choose the Join the Community button on the right to answer this question in the AAII Community.
Answer This Question in the AAII Community »
AAII Sentiment Survey
The results from the latest AAII Sentiment Survey show neutral sentiment rising back above its historical average. In addition, the number of investors describing their outlook for stocks as “bearish” fell to an eight-week low.
Bullish sentiment, expectations that stock prices will rise over the next six months, declined 1.9 percentage points to 27.7%. The pullback puts optimism right at the breakpoint between typical and unusually low readings. Bullish sentiment remains below its historical average of 38.0% for the 36th consecutive week.
Neutral sentiment, expectations that stock prices will stay essentially unchanged over the next six months, rose 4.0 percentage points to 32.2%. This is the first time in seven weeks that neutral sentiment is above its historical average of 31.5%. Neutral sentiment was last higher on April 21, 2022 (37.3%).
Bearish sentiment, expectations that stock prices will fall over the next six months, declined 2.1 percentage points to 40.1%. The decrease puts pessimism back within its typical range of readings for the first time since June 2, 2022. (The breakpoint between typical and unusually high readings is currently 40.5%.) Nevertheless, bearish sentiment is above its historical average of 30.5% for the 35th time out of the past 36 weeks.
The bull-bear spread (bullish minus bearish sentiment) is –12.4% and is unusually low for the 24th time in 27 weeks. The breakpoint between typical and unusually low readings is currently –10.8%.
Historically, the S&P 500 index has gone on to realize above-average and above-median returns during the six- and 12-month periods following unusually low readings for the bull-bear spread.
Continued volatility in the major stock indexes along with inflation, corporate earnings and increased chatter about the possibility of a recession are all likely weighing on individual investors’ short-term expectations for the stock market. Also influencing sentiment are monetary policy, the coronavirus pandemic, politics and the ongoing invasion of Ukraine by Russia.
Bullish: 27.7%, down 1.9 points
Neutral: 32.2%, up 4.0 points
Bearish: 40.1%, down 2.1 points
Bullish: 38.0%
Neutral: 31.5%
Bearish: 30.5%
See more Sentiment Survey results.

July 21, 2022 Small-Cap Stocks Are Still on Sale
July 14, 2022 10 High-Yielding Stocks With Risky Dividends
July 7, 2022 Five Bear Market Moves for Tax-Savvy Investors
June 30, 2022 Four Ways to Identify Companies at Risk of Going Bankrupt

Discussion
Barry from TX posted over 4 years ago:
Charles, thanks for the review of prior Fed rate hikes and the outcomes they produced. So, what can we learn from this? if Goldilocks had encountered 11 economists rather than 3 bears (a very much scarier scenario than the Grimm Brothers ever envisioned) she would have still found only one porridge that was ”just right.” From Goldilocks’ experience we might learn: (1) If we ask 11 economists anything, we can expect, at most, one useful answer. (2) We have to expect several outcomes to be gruel, a thinner version porridge. (“May I have some more, sir!”) And (3) Maybe we need more Mama Bears on the FOMC to increase our odds for finding “just right” porridge. (Just not Janet Yellen.)
You need to log in as a registered AAII user before commenting.
Create an account