

Small-Cap Stocks Are Still on Sale
by Charles Rotblut | July 21, 2022
Seven weeks ago, I shared data showing how the bear market has made relative valuations cheap for small-cap stocks. This sale is continuing.
Consider the data shared late last week by Lindsey Bell, the chief markets and money strategist for financial services company Ally. The relative valuation of the Russell 2000 index’s price-earnings (P/E) ratio compared to the S&P 500’s price-earnings ratio is 25% below the historical average.
In commenting on the relationship Bell wrote, “The Russell 2000 usually trades at a pretty steep premium, on a P/E basis, to the S&P 500 given the higher risk and volatility associated with small companies. When comparing the P/Es of these two indices, the premium for the small caps has shrunk to levels not seen since 2008. That’s a rare occurrence.”
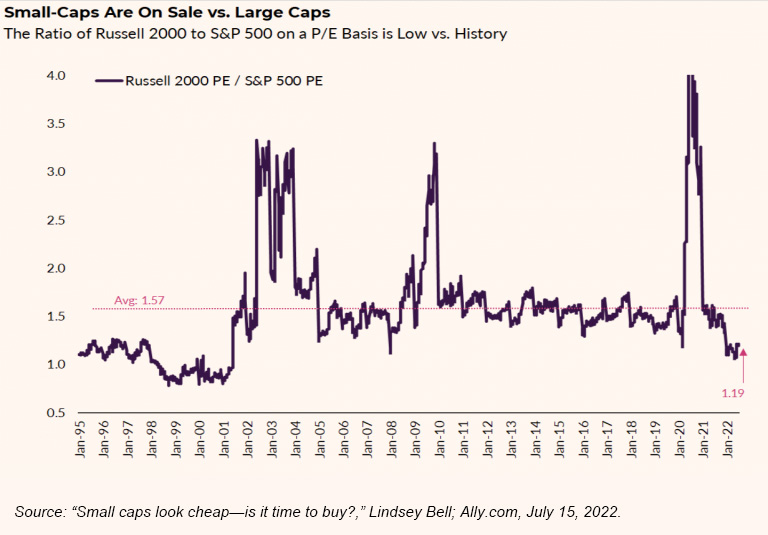
Since 1995, the Russell 2000’s price-earnings ratio commanded a premium of 1.57 times the S&P 500’s ratio. As of last week, the premium had shrunk to 1.19. Granted, the average premium reflects three very big surges but consider the timing of those surges. Each of those surges occurred as the stock market was recovering from recessions and bear markets.
“Historically, the recovery in stocks of all sizes begins before a recession ends. And small-cap shares tend to recover more quickly than large caps,” explained Bell. “The data between 1953 and 2009 shows that the average return for small caps was about 17% in the second half of a recession, compared to just under 11% for large caps. The outperformance has continued in the year after those recessions ended. Of course, it’s hard to say exactly where we are in the economic cycle right now.”
While it would be wonderful to wait until there were clear signs of a bottom having been set in the market, doing so could cost you a large amount in terms of forfeited wealth. Missing the worst days typically also means missing the best days. Six of the 10 best trading days in the market occurred within two weeks of the 10 worst trading days.
Even missing the best months, which tend to occur close to the worst months, can cost you dearly. Consider what AAII president John Bajkowski observed in his latest Model Shadow Stock Portfolio update. (The Shadow Stock strategy seeks small, deep-value stocks.)
“Being out of the market during the best-performing month each year over the 29.5-year history of the Model Shadow Stock Portfolio reduced the compound annual growth rate (CAGR) from 13.6% to 3.2%.
“If you were out of the market during the worst month of each year, the compound annual growth rate is increased from 13.6% to 25.1%.
“Even more surprising was the impact of being out of the market for both the best and worst month of each year. The 13.6% return of the Model Shadow Stock Portfolio as a result of skipping both the best and worst month matches the 13.6% of being fully invested.”
Missing the best and worst month every year would certainly reduce your portfolio’s volatility. Attempting to do it would overlay a massive amount of behavioral and timing risk. It’s simply not worth incurring those dual risks.
So rather than trying to find the ideal time to act, consider whether taking advantage of the current sale in small-cap stocks makes sense for your portfolio.

- You can read more about John Bajkowski’s insights into how missing the best month of the year can significantly hurt returns in his latest Model Shadow Stock Portfolio update.
- The CAPE ratio has pulled back significantly from its highs. Learn what the CAPE ratio considers and how to use it.
- Speaking of learning, many college graduates are starting their first jobs. If you are a new empty nester, I share suggestions for updating your financial plan in this month’s AAII Journal.
- If inflation is impacting your plans, you’re not alone. Anine Sus breaks down how inflation is affecting her budget.
Members are looking for your input. Can you help with this question from the Income Investing Community?
“I have a question about buying individual bonds that mature in six months. I’m new to buying individual bonds and trying to learn something. Is this a valid strategy or am I missing something that should be considered?”
Tap the button and then choose the Join the Community button on the right to answer this question in the AAII Community.
Answer This Question in the AAII Community »
AAII Sentiment Survey
Pessimism among individual investors about the short-term direction of the stock market continued to decline, falling to a seven-week low in the latest AAII Sentiment Survey. At the same time, optimism extended its rebound into a second week by rising to a seven-week high.
Bullish sentiment, expectations that stock prices will rise over the next six months, rose 2.7 percentage points to 29.6%. The increase puts optimism back within its typical range of readings for the first time since June 2, 2022. (The breakpoint between typical and unusually low readings is currently 27.7%.) Nonetheless, bullish sentiment is below its historical average of 38.0% for the 35th consecutive week.
Neutral sentiment, expectations that stock prices will stay essentially unchanged over the next six months, increased 1.6 percentage points to 28.2%. Neutral sentiment is below its historical average of 31.5% for the 12th time in 13 weeks.
Bearish sentiment, expectations that stock prices will fall over the next six months, dropped 4.3 percentage points to 42.2%. Pessimism was last lower on June 2, 2022 (37.1%). Bearish sentiment is above its historical average of 30.5% for the 34th time out of the past 35 weeks and is at an unusually high level for 23rd time out of the last 27 weeks. The breakpoint between typical and unusually high readings is currently 40.5%.
The bull-bear spread (bullish minus bearish sentiment) is –12.6% and is unusually low for the 23rd time in 26 weeks. The breakpoint between typical and unusually low readings is currently –10.8%.
Historically, the S&P 500 index has gone on to realize above-average and above-median returns during the six- and 12-month periods following unusually low readings for the bull-bear spread. Unusually high bearish sentiment readings historically have also been followed by above-average and above-median six-month returns in the S&P 500.
Continued volatility in the major stock indexes along with inflation, corporate earnings and increased chatter about the possibility of a recession are all likely weighing on individual investors’ short-term expectations for the stock market. Also influencing sentiment are monetary policy, the coronavirus pandemic, politics and the ongoing invasion of Ukraine by Russia.
Bullish: 29.6%, up 2.7 points
Neutral: 28.2%, up 1.6 points
Bearish: 42.2%, down 4.3 points
Bullish: 38.0%
Neutral: 31.5%
Bearish: 30.5%
See more Sentiment Survey results.

July 14, 2022 10 High-Yielding Stocks With Risky Dividends
July 7, 2022 Five Bear Market Moves for Tax-Savvy Investors
June 30, 2022 Four Ways to Identify Companies at Risk of Going Bankrupt
June 23, 2022 Traders Misjudge Volatility Following Big Moves in the VIX

Discussion
Barry from TX posted over 4 years ago:
Charles, we need more articles like this one. kudos. This short article (1) provides timely data (2) in a simple format (3) that is easy to interpret and (4) provides relevant comparisons ... and (wait for it) ... Ta De Ta Ta Tahhh !!! ... (5) graphs with TRENDS. You get extra credit for using Lindsey Bell of ALLY as the source of your rationale. I follow her weekly updates and find her analyses similar to this article -- well thought through and documented with clear and cogent data trends. I recommend you (and Jenna) interview her for a future an AAII column(s). There are other young women CIOs and analysts you might want to interview. I know I am going to get Aristotle's Reward for this, but AAII members -- old and new -- could benefit from the views of younger (and living) analysts, especially women like Lindsey. I have found Liz Sonders @ SCHW and Liz Young @ SoFi to be similarly informative. I use their inputs to ballast AAII research and make the financial foundations of the seminal AAII “gurus” – Cloonan, Graham/Dodd, the “Nobels,” and the minds behind the AAII ALL Star Screens -- actionable in today’s markets.
Christopher from VA posted over 4 years ago:
I actually do not understand this graph. The current P/E of the Russel 2000 is 63, while the S&P 500 is 21 (a 3:1 ratio). The projected forward ratio is 20 and 17 respectively (about a 1.25:1 ratio). Both of these ratios come from the Barrens market data website as of 7/22/22. So at the present the price/earnings ratio is the 3:1, which is projected to fall to 1.25:1. So that seems like a pretty pronounced project decline of the ratio. The graph seems to be showing projected data based on these numbers from Barrons. Either the price has to come down or the earnings have to go up (or both) for the P/E to decline. 1. Am I interpreting this correctly? 2. Do we invest based on the projected contraction of the small cap price relative to earnings? Or do we wait to see if it materializes? It seems like some interpretation and context would be useful (at least to me).
Christopher from VA posted over 4 years ago:
Further ignorance: If the small caps (Russel 2000) are more risky, wouldn't they have a lower P/E than more stable stocks (S&P 500)? I would think investors would demand a discount on price to compensate for greater risk and volatility. That should be reflected in a lower P/E ratio. What am I missing? Thanks for any education!
You need to log in as a registered AAII user before commenting.
Create an account