

Traders Misjudge Volatility Following Big Moves in the VIX
by Charles Rotblut | June 23, 2022
The volatility of stock returns decreases with time. Big short-term upward and downward moves get smoothed out, reducing the fluctuations of returns. This is why it is advantageous to look at your portfolio infrequently.
Looking too often does more than just potentially fraying your nerves. It also alters your perception. When you pay attention to what the market is doing on daily basis, the odds of you misjudging how volatile stocks are increases. A study in the current issue of the Financial Analysts Journal demonstrated this using distortions in the CBOE Volatility Index (aka, the VIX).
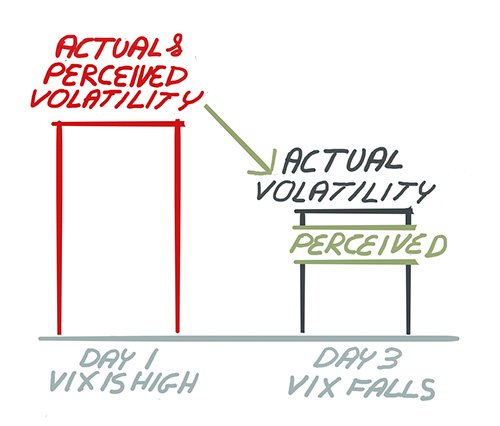
“After prolonged exposure to high (low) realized volatility, perceived volatility is lower (higher) than actual realized volatility,” observed the study’s authors. “Future realized volatility is higher than implied by VIX … following volatility regimes in which volatility switches from extremely high levels to moderate levels, and vice versa.”
Very high levels are those that are more than one standard deviation above the rolling three-month (63 business days) average. Very low levels are those that are more than one standard deviation below average. The larger the difference between the VIX and its average, the larger the distortion in perceived volatility levels when the VIX moves back into its average range.
A simplified version of the trading strategy proposed in the study would be to shift from stocks to cash when volatility is at a very high level (with a bigger advantage to doing so when the VIX is at least 1.50 standard deviations above its average, and particularly at least 1.75 standard deviations higher). Elise Payzan-LeNestour, a Scientia Associate Professor at the University of New South Wales and one of the study’s authors, told me in an email that “most of [the strategy’s outperformance] comes from missing large drawdowns.”
While I am not a fan of market-timing strategies—because they add both timing and behavioral risks—it is possible to “sin a little” by paying attention to the VIX. If you were to calculate the averages and standard deviations (with a spreadsheet and widely available VIX quote data), you could use the level of the VIX to determine if it might be worth waiting a few days to invest new savings contributions or postpone taking withdrawals.
Such a strategy is in the same ballpark of what contributing editor Brian Haughey suggested in this month’s AAII Journal. His strategy called for looking for a move by the VIX above its five-day moving average. Such a breakout implies a potential decrease in volatility and higher returns for the S&P 500 index going forward. Investors seeking to invest new savings contributions or take withdrawals during periods of heightened volatility could wait for the VIX to rise above its five-day moving average before taking action.
The key with “sinning a little” is to have set parameters to ensure you don’t go from a little sinning to a lot of sinning. Just like having an occasional tasty dessert won’t wreck your diet, having one every day very well could. One rule would be to use a timing indicator for day X through day Y. On day Y, you invest the contribution or take the withdrawal no matter what the indicator suggests if you haven’t already acted. This rule can also work when you are simply trying to determine when to put cash to work, take a withdrawal or adjust your allocation. Keep in mind that it only works if you act by Day Y and do not look for additional reasons to delay acting.
Of course, the alternative—investing new savings or taking withdrawals on pre-specified dates regardless of where the VIX (or any other market-timing metric) stands—is often the best strategy. Doing so avoids second-guessing, incorrect forecasts and many other behavioral errors.

- Here’s Brian Haughey’s article on using the VIX to measure market volatility trends.
- A 2016 study found that the volatility of stocks has been rising over time when measured on a daily basis, but not when measured on a monthly basis.
- My colleagues Derek Hageman and Matt Markowski share ideas for finding attractive stocks in our latest Individual Investor Show, which was just released on podcast apps (including Amazon Music) and YouTube.
- AAII assistant editor Anine Sus talks about how much she is contributing to her retirement savings in her latest My Investing Discoveries blog post.
Members are looking for your input. Can you help with this question from the Income Investing Community?
“For income investors, [I’m] looking for feedback on EFR (Eaton Vance Sr. Floating Rate fund) … Need opinions on whether the current price looks attractive as an entry point?”
Tap the button and then choose the Join the Community button on the right to answer this question in the AAII Community.
Answer This Question in the AAII Community »
AAII Sentiment Survey
The percentage of individual investors expressing optimism about the short-term direction of stocks fell to among the lowest levels ever recorded in the AAII Sentiment Survey. At the same time, pessimism rose to one of its highest levels ever recorded.
Bullish sentiment, expectations that stock prices will rise over the next six months, declined 1.2 percentage points to 18.2%. This is a two-month low. Optimism was last lower on April 28, 2022 (16.4%). Bullish sentiment is below its historical average of 38.0% for the 31st consecutive week and at an unusually low level for the 18th time in 22 weeks.
Neutral sentiment, expectations that stock prices will stay essentially unchanged over the next six months, increased 0.2 percentage points to 22.5%. Neutral sentiment is below its historical average of 31.5% for the eighth time in nine weeks. It is also at an unusually low level for the third time in eight weeks.
Bearish sentiment, expectations that stock prices will fall over the next six months, rose a full percentage point to 59.3%. This is an eight-week high. Pessimism was last higher on April 28, 2022 (59.4%). Bearish sentiment is above its historical average of 30.5% for the 30th time out of the past 31 weeks and at an unusually high level for the 11th time in 13 weeks.
The bull-bear spread (bullish minus bearish sentiment) is –41.1% and is unusually low for the 21st time in 24 weeks.
This week’s bullish sentiment reading is the 25th lowest in the survey’s history. This week’s bearish sentiment reading is the sixth highest ever recorded. This week’s bull-bear spread is the seventh most negative ever recorded. (The weekly AAII Sentiment Survey started in July 1987.)
Historically, the S&P 500 index has gone on to realize above-average and above-median returns during the six- and 12-month periods following unusually low readings for bullish sentiment and for the bull-bear spread. Unusually high bearish sentiment readings historically have also been followed by above-average and above-median six-month returns in the S&P 500. The S&P 500 has underperformed following periods of below-average neutral sentiment, though the link is weaker.
Continued volatility in the major stock indexes along with inflation, corporate earnings and increased chatter about the possibility of a recession are all likely weighing on individual investors’ short-term expectations for the stock market. Also influencing sentiment are monetary policy, the coronavirus pandemic, politics and the ongoing invasion of Ukraine by Russia.
Bullish: 18.2%, down 1.2 points
Neutral: 22.5%, up 0.2 points
Bearish: 59.3%, up 1.0 points
Bullish: 38.0%
Neutral: 31.5%
Bearish: 30.5%
See more Sentiment Survey results.

June 16, 2022 The Fed's Rising Expectations for Interest Rates
June 9, 2022 Combining Growth and Value Boosts Large-Cap Returns
June 2, 2022 Small-Cap Stocks Are Cheaper; Not So Much for Large-Cap Stocks
May 26, 2022 Suggestions for Customizing the 60/40 Portfolio (and Other Allocations)

Discussion
Barry from TX posted over 4 years ago:
Thanks, Charles, although YOUR advice is excellent for anyone, I pass on accepting that this research proves anything useful (other than meeting their tenure publishing requirements.) I downloaded the referenced source document , Harnessing Neuroscientific Insights to Generate Alpha by Payzan-LeNestour et al. I was underwhelmed by the reliability of research methodology. The authors created loose definitions to measure their key outcomes (oops!), and -- mirabile dictu! -- then used them ever "just so" conveniently to "prove" their hypothesis (i.e., that test subjects who looked at volatility data more frequently "misestimated" -- EITHER underestimated or overestimated -- "actual" volatility more than a control group. Self-selection and other uncontrolled behavioral biases might just be in play here. The authors then have an investment strategy on hand that increases alpha by 4% or so. Surprise!
You need to log in as a registered AAII user before commenting.
Create an account