

The Fed's Rising Expectations for Interest Rates
by Charles Rotblut | June 16, 2022
The last time I recall writing about the Federal Open Market Committee’s (FOMC) forecasts was in 2019. Yesterday’s 75-basis-point (0.75%) increase—the first triple quarter-point hike since 1994—warrants an updated discussion.
The individual forecasts of committee members are made public four times a year. Yesterday was one of those times. You can see the individual forecasts plotted on a chart as individual dots. Hence the references to the “dot plot.”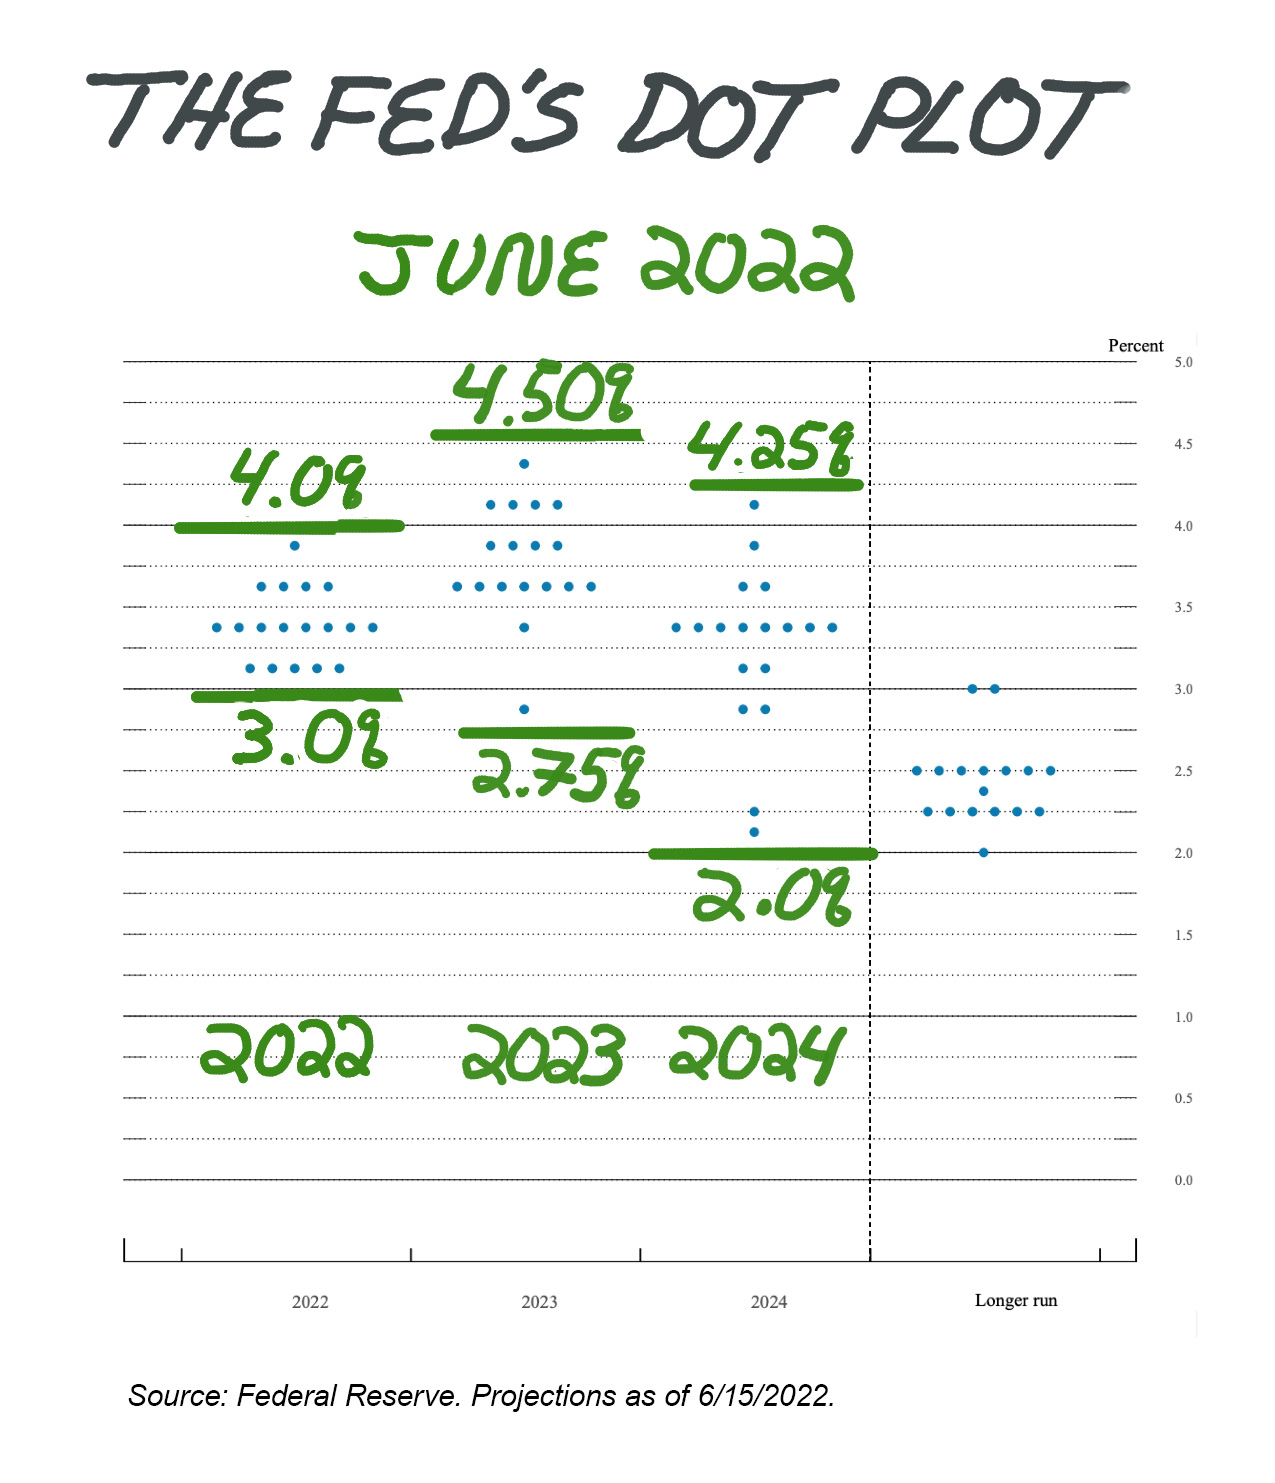
The dot plot currently shows a median expectation for the federal funds rate to be 3.4% this year and 3.8% next year, versus a range of 0.0% to 0.25% this past January. The target rate is projected to pull back to 3.4% in 2024. As you can see on the chart to the right, there is quite a bit of variance between the low and high forecast for 2023 and even a bigger variance for 2024.
When we look specifically at the past six months, the magnitude of the shift in expectations can be seen. Here are the median 2022 projections for the federal funds rate from FOMC members:
- December 2021: 0.9%;
- March 2022: 1.9%;
- June 2022: 3.4%.
The key reason is well-known: inflation. The FOMC’s projections of 2022 personal consumption expenditures (PCE) inflation have been revised upward from 2.6% in December 2021 to 4.3% in March 2022 and 5.2% this week. Federal Reserve chair Jerome Powell described inflation risks as being “weighted to the upside” in his prepared remarks at yesterday’s press conference. Supply chain issues, oil and grain disruptions attributable to Russia’s invasion of Ukraine, China’s coronavirus-related shutdowns and the tight labor market are all contributors.
Inflation has been both stickier and stronger than Powell and other FOMC members have expected. Though there never seems to be a shortage of criticism thrown in the Fed’s direction, it’s important to realize that the FOMC members have access to a great deal of information and a staff of economists. Even with all the data and analysis, they’ve still misjudged the persistence of inflation. Furthermore, the record of the Fed successfully orchestrating economic soft landings has not been good.
(There is a long record of monetary policy and how the economy has performed after policy announcements. The same cannot be said for many forecasters and pundits who speak or write with more confidence than they should. Forecasts are fallible and everyone is using cracked crystal balls.)
Implications of the Interest Rate Hike for Individual Investors
A potential silver lining exists for those of you who have been waiting a long time for higher interest rates on your savings. Banks won’t raise their interest rates in lockstep, but the rate hikes should help. The interest rate paid on my Discover savings account has risen from 0.45% at the start of this year to 0.95% today. (This rate is available to all AAII members; go to www.aaii.com/discover for more information.)
Bond yields have been rising since late May. Those of you who have laddered bonds have the chance this year to reinvest the proceeds of maturing securities at higher interest rates. It’s the same with certificates of deposit (CDs).
For borrowers with variable interest rates, the news is not great. This is particularly the case for those with credit card debt. The best thing you can do is to pay down the debt as quickly as possible. The second-best thing would be to see if a balance transfer at a lower rate would make sense. (Be sure to read the fine print regarding the terms.)
In terms of stocks, the rate hike is also a mixed bag. Mr. Market wants the Fed to keep inflation from getting out of control. Tightening monetary policy too much and too quickly runs the risk of triggering a recession. Higher interest rates also prompt investors to demand higher expected returns as compensation, which in turn lowers stock prices.
We’ve seen this repricing of equities occur over the past couple of months—and certainly today. These adjustments do not occur in a vacuum—traders also weigh many other factors—but they do occur. Most importantly, the market tends to be forward-looking.
Finally, remember that investing is a long-term exercise. As investors, we don’t get to choose the market and economic conditions that exist throughout our lifetimes. We do get to choose how we react to them. The returns from following a disciplined approach are always likely to be higher than the returns from making decisions based on what you think might happen.

- One way to protect your portfolio against inflation in retirement is to maintain a significant allocation to equities and take required minimum distributions (RMDs), explains Craig Israelsen in the current AAII Journal.
- Here’s what you need to know about I bonds, which are in demand now given the current level of inflation.
- Long-term investors who are looking to put more money to work in the current environment may want to “sin a little” by paying attention to where the S&P Volatility Index (VIX) is relative to its five-day moving average.
Members are looking for your input. Can you help with this question from the Mutual Funds & ETFs Community?
“In the June 2022 issue of the AAII Journal, Matt Bajkowski writes about the benefits of mid-cap funds like the opportunity for growth and the fact that many pay dividends. How is your current portfolio allocated across different equity cap ranges?”
Tap the button and then choose the Join the Community button on the right to answer this question in the AAII Community.
Answer This Question in the AAII Community »
AAII Sentiment Survey
The percentage of individual investors expecting stock prices to fall over the next six months is above 50% for the fifth time in eight weeks. The latest AAII Sentiment Survey also shows short-term optimism about stocks falling below 20%.
Bullish sentiment, expectations that stock prices will rise over the next six months, declined 1.6 percentage points to 19.4%. The drop puts optimism at a seven-week low. Bullish sentiment is below its historical average of 38.0% for the 30th consecutive week and at an unusually low level for the 17th time in 21 weeks.
Neutral sentiment, expectations that stock prices will stay essentially unchanged over the next six months, plunged by 9.9 percentage points to 22.2%. Neutral sentiment is below its historical average of 31.5% for the seventh time in eight weeks. It is also at an unusually low level for the second time in seven weeks.
Bearish sentiment, expectations that stock prices will fall over the next six months, jumped 11.5 percentage points to 58.3%. This is a seven-week high. It keeps bearish sentiment above its historical average of 30.5% for the 29th time out of the past 30 weeks and at an unusually high level for the 10th time in 11 weeks.
The bull-bear spread (bullish minus bearish sentiment) is –38.9% and is unusually low for the 20th time in 23 weeks.
Most of this week’s responses were recorded prior to yesterday, when the Federal Open Market Committee (FOMC) announced a 75-basis-point interest rate hike.
Historically, the S&P 500 index has gone on to realize above-average and above-median returns during the six- and 12-month periods following unusually low readings for bullish sentiment and for the bull-bear spread. Unusually high bearish sentiment readings historically have also been followed by above-average and above-median six-month returns in the S&P 500. The S&P 500 has also underperformed following periods of below-average neutral sentiment, though the link is weaker.
Continued downward volatility in the major stock indexes along with corporate earnings may have heightened concerns among many individual investors about the possibility of further downside in the stock market. Also influencing sentiment are inflation, interest rates, the coronavirus pandemic, politics, the ongoing invasion of Ukraine by Russia, stock market volatility and the economy.
Bullish: 19.4%, down 1.6 points
Neutral: 22.2%, down 9.9 points
Bearish: 58.3%, up 11.5 points
Bullish: 38.0%
Neutral: 31.5%
Bearish: 30.5%
See more Sentiment Survey results.

June 9, 2022 Combining Growth and Value Boosts Large-Cap Returns
June 2, 2022 Small-Cap Stocks Are Cheaper; Not So Much for Large-Cap Stocks
May 26, 2022 Suggestions for Customizing the 60/40 Portfolio (and Other Allocations)
May 19, 2022 Guidelines for Contrarian Investors Going Bargain Hunting

Discussion
Robet from Missouri posted over 4 years ago:
Sadly it may be time to start thinking about the second Great Depression where stocks declined 90%. Expectations are at least for a 75% reduction from highs even if we avoid depression and only have serious recession. But it more and more appears that we are heading for a global second Great Depression. Certainly hope I am wrong! But have been through enough of these to know the signs. And they are not good. Add to this chances of WWIII perhaps already underway and it is time to batten down the hatches! Who would have thought in less than two years we would be where we are today. Certainly not me!
Barry J from TX posted over 4 years ago:
Charles, It’s great to see AAII open the door for members to comment on this highly important but very political issue. (What else is new?) How did we get into this “hot mess?” As Robert points out, as of late 2020 the economy and the markets were humming. Happy days. What happened? An election (11/20). A new administration (01/21 to now). A pandemic (03/21-06/22). $1,900,000,000 (trillion) federal fiscal stimuli that literally gave away HUGE amounts of cash into the money supply (M2) (06/21 and 12/21). The Fed “inflated” its own balance sheet by buying USTs and MBSs which produced ultra-cheap liquidity that stimulated risky investments in risky assets and sub-prime lending (06/21 to 06/22). A war (02/22 to now). Supply chain shortages, esp. oil, grains, parts, semiconductors, etc. (1/22 to now). I know left some things out. The rapid increase in the median dot plot is clue #1. My point is -- how did the FOMC NOT KNOW / CHOOSE TO IGNORE all these events that dominated all the news outlets during this time? This fact points to serious lag times in the FOMC process. They only meet 4 times a year, and when they get together they cannot agree on their own data everyone has access to. The large variation in dot plot points at the 06/22 FOMC meeting is clue #2. The Fed process is broken. How could the FOMC NOT KNOW / CHOOSE TO IGNORE their own data, models, and their HUGE internal staff economist resources? Clues #3 and #4 are the recent “apologies” by SoT Yellen and former Fed chair and Fed chair Powell that they blew it … they CHOSE TO IGNORE the news AND their on data. (Several recent WSJ articles document this timeline and these mea culpas.) The first rule of process management is that every process produces the outcomes it was DESIGNED to produce. If you want to improve a process, you have to REDESIGN the process systematically. The FOMC process is broken. NO resignations? So, exactly how sorry are Janet and Robert? I liked to see a FOMC dot plot on that. Who will fix it? Guess who?. “Person of Interest” #1 and “POI #2.” And yes, that HUGE posse of economists at the Fed (obviously suffering less than full employment) will produce an enormous series of research papers ex post facto what will also be ignored. Robert, if WWIII is looming, be thankful that POI #1 and POI #2 are not in charge of DoD. They would not foresee WWIII coming … even after 8 meetings over 2 years or so.
You need to log in as a registered AAII user before commenting.
Create an account