

Combining Growth and Value Boosts Large-Cap Returns
by Charles Rotblut | June 09, 2022
Featured Tickers: VIGRX
VIVAX
VIGRX
VIVAX
Morningstar’s vice president of research John Rekenthaler looked at whether it would be possible to outperform the S&P 500 index by splitting a portfolio into growth and value stocks. He specifically looked at holding both the Vanguard Growth Index fund  (VIGRX) and the Vanguard Value Index fund (VIVAX).
He found that it was possible to outperform the S&P 500 by both holding and rebalancing the growth and value funds. The big advantage occurred when rebalancing was done once every five years. Doing so resulted in an annualized advantage of 0.28%. A portfolio holding the two funds rebalanced once every five years turned $10,000 into $87,013 on an inflation-adjusted basis. The same amount invested in the S&P 500 grew to $80,772 on an inflation-adjusted basis.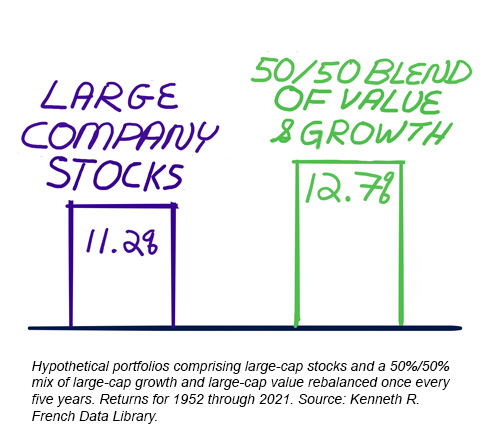
Rekenthaler analyzed return data for the period of December 1992 through May 2022. After seeing his findings, I was curious as to whether the advantage of combining growth and value held up over longer periods.
The Vanguard funds used by Rekenthaler both started in 1992, so doing an apples-to-apples comparison over a longer period was not possible. The workaround I opted for was to use Dartmouth professor Kenneth French’s online database. He has longer-term data on growth and value stocks. Growth in this case is defined as stocks with a high valuation, while value is defined as stocks with low valuations.
French also has return data based on market-capitalization size. Large is defined as a market cap ranking in the top 30%. This is a larger universe than the S&P 500 but close enough for our purposes. A market-cap-weighted portfolio of large-company stocks realized an annualized return of 11.2% between 1952 and 2021.
Historically, stocks with low valuations have outperformed stocks with high valuations by a wide margin. This is very evident in the French data. Between 1952 and 2021, portfolios of large-company stocks with low price-earnings (P/E) ratios (value) realized an annualized return of 14.4%. Portfolios comprising stocks with high price-earnings ratios (growth) realized a return of 10.3% over the same period. Value has also beaten growth by a wide margin when the price-to-book-value (P/B) ratio or the price-to-cash-flow (P/CF) ratio was used.
These returns simply pitted value versus growth. To see what would have happened if both were combined into a single portfolio, I tested a 50%/50% mix of value and growth rebalanced annually and rebalanced once every five years.
In both cases, overall returns for these split portfolios were better than merely holding large-company stocks in general. Using the price-earnings ratio to determine large-company growth and value stocks, the 70-year annualized returns were 12.6% and 12.7% for the 50/50 portfolios that were rebalanced annually and once every five years, respectively.
The returns for combining value and growth into a single portfolio were less appealing, however, than merely allocating to value alone. As the numbers above show, a portfolio solely allocated to large-company value stocks realized a nearly two-percentage-point return advantage over a 50/50 portfolio.
Growth dragged down the performance of the blended portfolios—even when no rebalancing was used. A similar effect occurred when price-to-book and price-to-cash-flow ratios were used. In all cases, the blended portfolios still outperformed the large-company-only portfolio. So there remained an advantage to splitting between growth and value. The advantage simply wasn’t as great as it would have been by solely allocating to value.
Rekenthaler’s analysis didn’t show an advantage to favoring value. This was due to the period he analyzed. The last 30 years were significantly impacted by the dot-com bubble of the late 1990s, last decade’s value drought and the historically low-interest-rate environment. During this period, growth outperformed value both on a price-to-book and price-to-cash-flow basis. On a price-earnings basis, value outperformed. The Vanguard growth fund beat out the Vanguard value fund.
The long-term odds favor value. The shorter-term (30-year) odds favor of growth. I personally prefer going with the longer-term odds as they cover a greater range of market and economic cycles.
Either way, both Rekenthaler’s and my analyses show a historical advantage to having replaced a broad market-cap-weighted large-company index fund with large-company growth and value funds [either mutual funds or exchange-traded funds (ETFs)]. If you choose to go down this path, look at the holdings of the mutual funds or ETFs you want to invest in. Depending on how they classify growth and value, the possibility of overlap exists. Pure value and pure growth strategies reduce the odds of this occurring.

- An alternative to combining growth and value is to hold an S&P 500 or broad-based index fund and then tilt your portfolio toward specific factors.
- One way of tilting your portfolio or diversifying it by style is to use stock screens to find stocks with specific characteristics.
- Stock splits are in the news with Amazon.com Inc. (AMZN) recently splitting its shares and Alphabet Inc. (GOOGL) scheduled to do so next week. Here’s what you need to know about stock splits.
- Assistant editor Anine Sus discusses how the Federal Reserve’s rate hikes are affecting the interest she’s earning on her high-yield savings account.
- I’ll give suggestions on how to review your allocation, progress toward financial goals and more in a live webinar next Thursday.
Members are looking for your input. Can you help with this question from the Sustainable Investing (ESG) Community?
“I recently saw an article discussing how to calculate/assess a company’s carbon footprint. Have you invested in the travel or recreation sector and, if so, what types of actions do you look for in a company to see if it is truly reducing its carbon footprint or not?”
Tap the button and then choose the Join the Community button on the right to answer this question in the AAII Community.
Answer This Question in the AAII Community »
AAII Sentiment Survey
The latest AAII Sentiment Survey shows a big reversal from last week. Optimism plunged while pessimism jumped.
Bullish sentiment, expectations that stock prices will rise over the next six months, pulled back by 11.0 percentage points to 21.0%. The drop puts optimism back at an unusually low level. It also keeps bullish sentiment below its historical average of 38.0% for the 29th consecutive week.
Neutral sentiment, expectations that stock prices will stay essentially unchanged over the next six months, increased 1.2 percentage points to 32.1%. This is the first time in seven weeks that neutral sentiment is above its historical average of 31.5%.
Bearish sentiment, expectations that stock prices will fall over the next six months, rose 9.8 percentage points to 46.9%. The increase puts pessimism back at an unusually high level. It also keeps bearish sentiment above its historical average of 30.5% for the 28th time out of the past 29 weeks.
Bullish sentiment is at an unusually low level for the 18th time out of the last 22 weeks. Bearish sentiment is at an unusually high level for the 17th time out of the last 21 weeks. The bull-bear spread (bullish minus bearish sentiment) is unusually low for the 19th time in 22 weeks.
Historically, the S&P 500 index has gone on to realize above-average and above-median returns during the six- and 12-month periods following unusually low readings for bullish sentiment and for the bull-bear spread. Unusually high bearish sentiment readings historically have also been followed by above-average and above-median six-month returns in the S&P 500.
The reversal in the major stock indexes along with corporate earnings may have heightened concerns among many individual investors about the possibility of further downside in the stock market. Also influencing sentiment are inflation, interest rates, the coronavirus pandemic, politics, the ongoing invasion of Ukraine by Russia, stock market volatility and the economy.
Bullish: 21.0%, down 11.0 points
Neutral: 32.1%, up 1.2 points
Bearish: 46.9%, up 9.8 points
Bullish: 38.0%
Neutral: 31.5%
Bearish: 30.5%
See more Sentiment Survey results.

June 2, 2022 Small-Cap Stocks Are Cheaper; Not So Much for Large-Cap Stocks
May 26, 2022 Suggestions for Customizing the 60/40 Portfolio (and Other Allocations)
May 19, 2022 Guidelines for Contrarian Investors Going Bargain Hunting
May 12, 2022 A Playbook for When the Stock and Bond Markets Are Down

Discussion
John L from NJ posted over 4 years ago:
The path to failure starts with the desire to beat the market. The second step is using what worked in the past in a mechanical fashion to guide future investment decisions. I have no clue if rebalancing a value and growth fund every five years will beat the S&P 500 in the future. Problem is that no one else knows either. What I do know is that it would be simpler to just buy an all market index fund or ETF and hold it.
Chris D from Illinois posted over 4 years ago:
Curious about where the threshold for "low P/E" was, <10x, <8x, lower? Loved the article and research!
John K. from Ohio posted over 4 years ago:
This analysis is flawed in that it compares the apples of the 70 year analysis with the oranges of the 30 year analysis by Rekenthaler. . The Morningstar results compared value with true growth, not with non-value or over-priced shares mischaracterized as "growth".. The CRSP index used in the Vanguard funds appropriately used 3 year past and future estimated growth in sales and earnings, not price/book, price/earnings, etc.as a measure of "growth".. Among the data Rekenthaler presented were a 10.23% 30 year annual growth return vs 9.70% value return. It shouldn't be surprising that in the long-term under-valued stocks out-perform over-priced stocks. It should be equally unsurprising that correctly characterized growth outperforms value over the long term.
John P from Louisiana posted over 4 years ago:
Relative strength calculations measuring growth against value , large vs small, etc can be very useful in determining where to "lean " in allocating assets . You can make big bets or small , and within either a short or longer term framework . Longer term works best in my experience , and , of course , there is less turnover . Where to go for relative strength data ? I would suggest Telechart ( Worden Bros. ) or NASDAQ/ Dorsey Wright .
You need to log in as a registered AAII user before commenting.
Create an account