

Four Ways to Identify Companies at Risk of Going Bankrupt
by Charles Rotblut | June 30, 2022
Special note: You can get access to every premium newsletter (future ones, too!) and A+ Investor for at least $300 off. AAII Platinum leverages seven model portfolios, their daily-updated watchlists, an exclusive dashboard, our trove of special reports and detailed analysis exploring different investing niches to help you build, handle and thrive in any market condition. Click here to learn more about AAII Platinum.
The worst possible outcome for a stock is bankruptcy. When a company files for bankruptcy, its shares are first delisted and then are eventually eliminated.
This fact was obviously lost on speculators who bid up shares of Revlon Inc. (REV) from $1.95 to as high as $9.89 after the company filed for Chapter 11 bankruptcy two weeks ago.
Revlon’s bankruptcy provides the opportunity to talk about warning signs to watch out for. A few key ratios and indicators can quickly tell you if a company is at risk of not being able to handle its debt.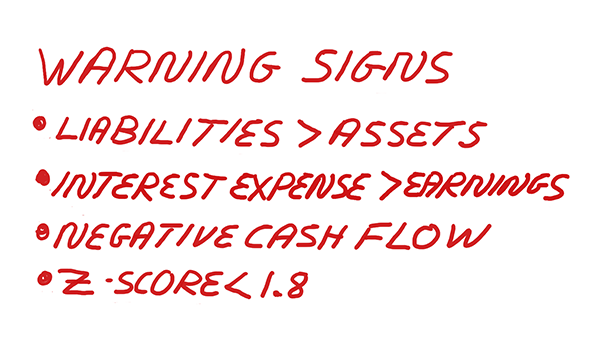
An obvious metric is the level of total liabilities relative to total assets. It’s easy to judge with a quick glance at the balance sheet. Revlon ended its first quarter with a total-liabilities-to-total-assets ratio of 187.5%. To put this number in perspective, Revlon’s proportionate debt level ranked in the highest 3% of all publicly traded companies. Yikes!
A high level of debt can be sustained if a company has the financial ability to meet its payment obligations. One way to determine this is to compare interest expense to earnings. These figures can be found on a company’s income statement. The times interest earned ratio (aka the interest coverage ratio) will give a more proportionate ratio than just eyeballing the levels. This ratio should regularly be above 1.0, which means earnings exceed interest expense. Ratios below 1.0 indicate that interest expense exceeds earnings. Revlon’s times interest earned ratio has been below 1.0 every year since 2016.
Cash from operations tells you whether a company’s normal business operations generate more cash than they use (cash flow positive) or burn through more cash than they generate (cash flow negative). Sustained negative cash flow from operations leaves a company at the mercy of its debtors and/or equity backers. Revlon had negative cash from operations every year between 2017 and 2021. Cash from operations can be found on the company’s cash flow statement.
A final way of gauging the risk of bankruptcy is to use the Altman Z-score. It was specifically developed to determine whether a company is at risk of incurring financial distress. We use Altman’s Z-double prime score in the A+ Investor and VMQ Stocks quality grades. Scores above 3.0 indicate that a company is not at risk of distress. Scores below 1.8 indicate that a company is likely headed for distress. Revlon’s Z-double prime score was –0.35 prior to filing for bankruptcy.
Any investor doing a cursory look before the bankruptcy filing would have recognized Revlon as a very risky stock by using one or more of these metrics. As investors, we help our portfolio performance by knowing when to eliminate a given stock from consideration.

- What happens to shareholders after bankruptcy occurs? I explained this in a 2011 AAII Journal article.
- I spoke to Edward Altman about how to use his Z-score to assess the risk of bankruptcy.
- If you’d rather hold exchange-traded funds (ETFs) than individual securities, robo-advisers can provide you with diversified portfolios.
Members are looking for your input. Can you help with this question from the Mutual Funds & ETFs Community?
“Recently, headlines have mentioned downward stock outlooks. After five weeks, the market will absorb upward and downward revisions as always. Any suggestions for funds to combat this?”
Tap the button and then choose the Join the Community button on the right to answer this question in the AAII Community.
Answer This Question in the AAII Community »
AAII Sentiment Survey
Pessimism among individual investors plunged this week but remains at an unusually high level in the latest AAII Sentiment Survey. Additionally, both bullish and neutral sentiment rose.
Bullish sentiment, expectations that stock prices will rise over the next six months, rose 4.6 percentage points to 22.8%. Bullish sentiment is below its historical average of 38.0% for the 32nd consecutive week and at an unusually low level for the 21 of the last 25 weeks.
Neutral sentiment, expectations that stock prices will stay essentially unchanged over the next six months, jumped 8.1 percentage points to 30.5%. Neutral sentiment is below its historical average of 31.5% for the ninth time in 10 weeks.
Bearish sentiment, expectations that stock prices will fall over the next six months, pulled back by 12.6 percentage points to 46.7%. Bearish sentiment is above its historical average of 30.5% for the 31st time out of the past 32 weeks and at an unusually high level for 20 of the last 24 weeks.
The bull-bear spread (bullish minus bearish sentiment) is –23.9% and is unusually low for the 22nd time in 25 weeks.
Historically, the S&P 500 index has gone on to realize above-average and above-median returns during the six- and 12-month periods following unusually low readings for bullish sentiment and for the bull-bear spread. Unusually high bearish sentiment readings historically have also been followed by above-average and above-median six-month returns in the S&P 500. The S&P 500 has underperformed following periods of below-average neutral sentiment, though the link is weaker.
Continued volatility in the major stock indexes along with inflation, corporate earnings and increased chatter about the possibility of a recession are all likely weighing on individual investors’ short-term expectations for the stock market. Also influencing sentiment are monetary policy, the coronavirus pandemic, politics and the ongoing invasion of Ukraine by Russia.
Bullish: 22.8%, up 4.6 points
Neutral: 30.5%, up 8.1 points
Bearish: 46.7%, down 12.6 points
Bullish: 38.0%
Neutral: 31.5%
Bearish: 30.5%
See more Sentiment Survey results.

June 23, 2022 Traders Misjudge Volatility Following Big Moves in the VIX
June 16, 2022 The Fed's Rising Expectations for Interest Rates
June 9, 2022 Combining Growth and Value Boosts Large-Cap Returns
June 2, 2022 Small-Cap Stocks Are Cheaper; Not So Much for Large-Cap Stocks

Discussion
No comments have been added yet. Add your thoughts to the discussion!
You need to log in as a registered AAII user before commenting.
Create an account