

10 High-Yielding Stocks With Risky Dividends
by Charles Rotblut | July 14, 2022
A juicy stream of dividend income is appealing—especially during a bear market. The danger is that what may seem appealing on the surface can have signs of rot at its core.
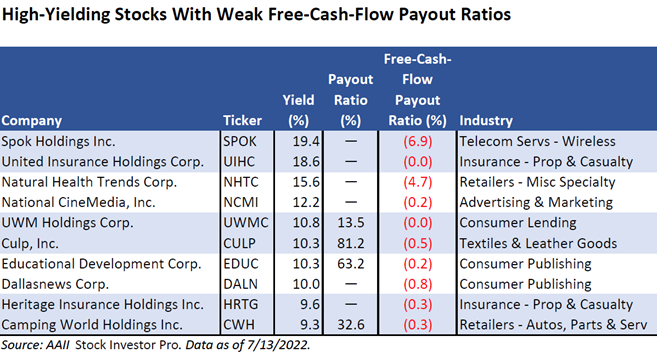
One of the ways to ensure a stock is ripe for being added and not at risk of spoiling your portfolio is to see how well the dividend is being covered. A popular way of doing this is to analyze the earnings payout ratio. A better way is to also look at the free-cash-flow payout ratio. On both measures, the 10 stocks listed below would have Mr. Whipple cringing, just as he would if somebody were squeezing the Charmin.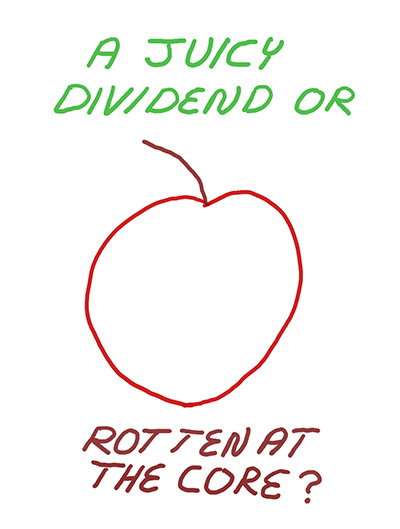
The earnings payout ratio is dividends per share divided by earnings per share. It shows you the extent to which 12 months of dividends are “covered” by 12 months of earnings. The further below 100% this ratio is (though staying positive), the greater the margin by which earnings exceed the dividend.
Earnings, however, are not cash. Income and expenses are reported irrespective of whether cash has been paid or received when accrual accounting is used. This can lead to situations when earnings are positive but cash flow (actual cash flowing in and out of the corporation) is negative.
To get around this problem, we take the free-cash-flow payout ratio into consideration when analyzing stocks for the AAII Dividend Investing (DI) portfolio.
Free cash flow shows how much cash a company has for discretionary spending. As DI editor Derek Hageman recently explained, “free cash flow is calculated by deducting capital expenditures (capex) from cash from operations. Cash from operations tries to look into the cash inflows and outflows caused by the core business operations and, in turn, the cash generated by the company’s products and services. Capex are funds used by a company to acquire, upgrade and maintain physical assets such as property, industrial buildings or equipment. Capex is often used by a firm to undertake new projects or make investments.
“What’s the purpose of deducting capex from cash from operations? Cash from operations offers an idea of how much cash a company’s day-to-day operations have generated. However, for a company to grow, it must also reinvest in itself to maintain operations as well as expand them. While skimping on capex is a way to save money in the short term, in the long run it is a surefire way to inhibit growth. This definition of cash flow describes a pre-dividend free-cash-flow figure. The residual cash amount indicates whether a company is generating enough cash from its normal business operations to fund its capital expenditures and still have money available to pay a dividend, retire debt, buy back shares or make acquisitions.”
The free-cash-flow payout ratio therefore analyzes how much cash a company is paying in dividends as a percentage of free cash flow. The ratio should be positive (the company is bringing more cash than it is spending) and below 100%. If it isn’t, then the dividend may not be sustainable.
Yields are often adjusted to reflect concerns about the dividend not being sustainable. Investors and traders demand a higher yield now as compensation for the possibility of the dividend being cut or suspended in the future. The greater the perceived risk, the higher the yield demanded.
The 10 stocks below are examples of this. Their high yields reflect concerns about their ability to maintain the current dividend payments. As you look at them, realize that any additional weakness in the economy could create more strain on the companies underlying these stocks. It’s a reminder that while high yields may be tempting, you should take care to ensure the dividend isn’t at risk of turning from juicy to rotten.

- For more on dividend payout ratios, see this “how-to” article by Derek Hageman.
- The “grande dame of dividends” Geraldine Weiss sought stocks with both good dividends and the fundamental strength to keep growing them. We revisit Weiss’ strategy in the July AAII Journal.
- Benjamin Graham also looked for fundamentally sound companies trading at discounted valuations. Find out what is passing our Graham Defensive Investor Utility screen and Non-Utility screen.
Members are looking for your input. Can you help with this question from the Allocation Strategies Community?
“I’ve been considering adding short-term bonds to my allocation for some time now. In your own allocation, how much are you allocated to short-/ultrashort-term bonds? In the past, was there another reason you were allocated toward these specific types?”
Tap the button and then choose the Join the Community button on the right to answer this question in the AAII Community.
Answer This Question in the AAII Community »
AAII Sentiment Survey
Optimism among individual investors about the short-term direction of the stock market rebounded to a six-week high, though continues to be unusually low. The latest AAII Sentiment Survey also shows drops in neutral and bearish sentiment.
Bullish sentiment, expectations that stock prices will rise over the next six months, jumped 7.5 percentage points to 26.9%. Optimism was last higher on June 2, 2022 (32.0%). Even with the increase, bullish sentiment is below its historical average of 38.0% for the 34th consecutive week and is at an unusually low level for the 23rd time in 27 weeks.
Neutral sentiment, expectations that stock prices will stay essentially unchanged over the next six months, declined 1.2 percentage points to 26.6%. Neutral sentiment is below its historical average of 31.5% for the 11th time in 12 weeks.
Bearish sentiment, expectations that stock prices will fall over the next six months, pulled back by 6.3 percentage points to 46.5%. Nonetheless, pessimism is above its historical average of 30.5% for the 33rd time out of the past 34 weeks and is at an unusually high level for 22 out of the last 26 weeks.
The bull-bear spread (bullish minus bearish sentiment) is –19.6% and is unusually low for the 24th time in 27 weeks.
Historically, the S&P 500 index has gone on to realize above-average and above-median returns during the six- and 12-month periods following unusually low readings for bullish sentiment and for the bull-bear spread. Unusually high bearish sentiment readings historically have also been followed by above-average and above-median six-month returns in the S&P 500. The S&P 500 has underperformed following periods of below-average neutral sentiment, though the link is weaker.
Continued volatility in the major stock indexes along with inflation, corporate earnings and increased chatter about the possibility of a recession are all likely weighing on individual investors’ short-term expectations for the stock market. Also influencing sentiment are monetary policy, the coronavirus pandemic, politics and the ongoing invasion of Ukraine by Russia.
Bullish: 26.9%, up 7.5 points
Neutral: 26.6%, down 1.2 points
Bearish: 46.5%, down 6.3 points
Bullish: 38.0%
Neutral: 31.5%
Bearish: 30.5%
See more Sentiment Survey results.

July 7, 2022 Five Bear Market Moves for Tax-Savvy Investors
June 30, 2022 Four Ways to Identify Companies at Risk of Going Bankrupt
June 23, 2022 Traders Misjudge Volatility Following Big Moves in the VIX
June 16, 2022 The Fed's Rising Expectations for Interest Rates

Discussion
No comments have been added yet. Add your thoughts to the discussion!
You need to log in as a registered AAII user before commenting.
Create an account