

Mutual Fund and ETF Investors Continue to Lower Their Returns
by Charles Rotblut | August 04, 2022
Imagine forfeiting nearly two full percentage points of return each year. No difference in the mutual funds or exchange-traded funds (ETFs) held versus the benchmark, just an annualized return that is 1.73% lower than how the same funds performed. Would you voluntarily choose to follow such a strategy?
Of course, you consciously would not. Yet, this is what happens to the typical mutual fund and ETF investor. The latest “Mind the Gap” study by Morningstar shows that fund investors are realizing a 10-year annualized return of 9.3% versus an 11.0% annualized return for the very funds they invested in. This equates to a 10-year forfeiture of more than $1,800 for every $10,000 invested, a substantial sum of money.
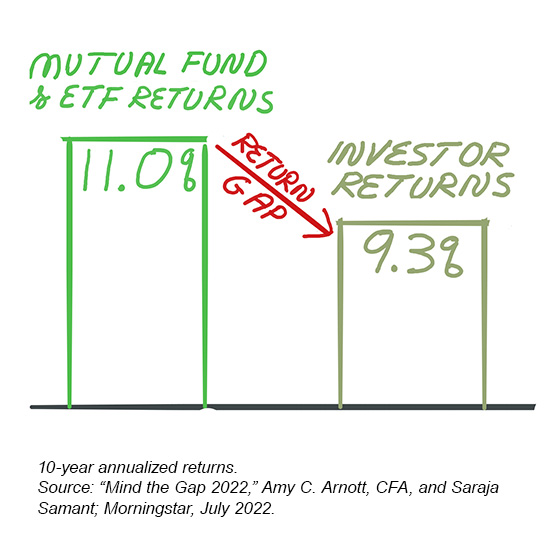
The return gap (aka “the behavior gap”) is attributable to the timing of the buy and sell decisions made by investors. A good example of this is sector funds, which many investors rotate in and out of based on their expectations. Sector mutual funds and ETFs have incurred a 10-year annualized return gap of –4.25%. Ouch!
Part of the reason for this large underperformance is tied to how investors react to volatility. When Morningstar grouped those funds by their relative level of volatility, the sector mutual funds and ETFs with above-average levels of volatility had considerably larger return gaps than those with below-average levels of volatility. The return gap for sector funds ranking in the least volatile quintile was –2.94%. For the highest quintile, the return gap was –4.94%. [Our A+ Investor risk grades for mutual funds and ETFs are based on quintile rankings, from the least volatile 20% (A) to the most volatile 20% (F).]
This link between higher volatility and bigger return gaps existed across most categories. The return gap for the most volatile U.S. equity funds was –1.48% versus –1.13% for the least volatile funds. For taxable bond funds, the return gap was for –2.37% for the most volatile and –0.70% for the least volatile funds. Simply put, the more volatile a fund was, the more likely investors were to buy and sell at the wrong time—and hurt their portfolios in the process.
One sizable category where this relationship between volatility and risk didn’t exist was allocation funds. The study’s authors Amy Arnott, CFA, and Saraja Samant attributed this to two factors. First, these types of funds are commonly held in workplace retirement plans like 401(k) plans. Target-date funds, for instance, are a common default allocation. Secondly, these funds tend to be less volatile because they combine a mix of assets.
Keep in mind that unless you make a lump-sum investment in a mutual fund or ETF, there will also be some difference between the returns you realize and returns of the funds themselves. Because I personally make regular paycheck contributions to my retirement accounts, I’m buying shares of mutual funds and ETFs throughout the year at differing prices. This leads to my annual returns differing from the returns of the funds themselves. Those of you who take regular portfolio withdrawals sell shares throughout the year will also experience some difference in returns.
Arnott and Samant acknowledge this: “If returns are generally positive, investors are typically better off making a lump-sum investment and holding it for the entire period … investors who buy and hold can take full advantage of performance trends when total returns are positive, but investors who contribute smaller amounts over time often have fewer dollars invested during periods with strong returns.” They then add, “But dollar-cost averaging can help investors avoid some of the ill effects of poorly timed cash flows by enforcing a more disciplined approach.”

- Speaking of fund returns, Matthew Bajkowski writes about the impact war and inflation continue to have on mutual fund and ETF performance this year.
- To help you incorporate the right mix of mutual funds and ETFs for your personal goals and risk tolerance, we are transitioning the Level3 Passive Portfolio to our Asset Allocation Models.
- We’re in the midst of earnings season. While positive earnings surprises are always welcome, big, upward revisions to earnings estimates are even better.
- Anine Sus discusses how charitable donations not only give you a tax deduction, but also represent an investment in your community and the world in her latest My Investing Discoveries blog post.
Members are looking for your input. Can you help with this question from the Allocation Strategies Community?
“What’s going on with the homebuilding industry? Stocks I have been following like BZH, LEN, TOL, PHM, as well as homebuilding exchange-traded funds (ETFs) like ITB and XHB have all been going up over the last few weeks. Could it be that their supply chains are opening up?”
Tap the button and then choose the Join the Community button on the right to answer this question in the AAII Community.
Answer This Question in the AAII Community »
AAII Sentiment Survey
Pessimism among individual investors about the short-term direction of the stock market fell for the fourth straight week in the latest AAII Sentiment Survey. Optimism, meanwhile, is above 30% for the first time in over two months.
Bullish sentiment, expectations that stock prices will rise over the next six months, rose 2.8 percentage points to 30.6%. This is the highest level of optimism recorded since June 2, 2022 (32.0%). Despite recent increases, bullish sentiment remains below its historical average of 38.0% for the 37th consecutive week.
Neutral sentiment, expectations that stock prices will stay essentially unchanged over the next six months, declined 1.6 percentage points to 30.6%. Neutral sentiment is below its historical average of 31.5% for the 13th time in 15 weeks.
Bearish sentiment, expectations that stock prices will fall over the next six months, declined 1.2 percentage points to 38.9%. Pessimism was last lower on June 2, 2022 (37.1%). Bearish sentiment is above its historical average of 30.5% for the 36th time out of the past 37 weeks.
Both bullish and bearish sentiment as well as the bull-bear spread are currently within their typical ranges.
Continued volatility in the major stock indexes along with inflation, corporate earnings and increased chatter about the possibility of a recession are all likely weighing on individual investors’ short-term expectations for the stock market. Also influencing sentiment are monetary policy, the coronavirus pandemic, politics and the ongoing invasion of Ukraine by Russia.
Bullish: 30.6%, up 2.8 points
Neutral: 30.6%, down 1.6 points
Bearish: 38.9%, down 1.2 points
Bullish: 38.0%
Neutral: 31.5%
Bearish: 30.5%
See more Sentiment Survey results.

AAII Asset Allocation Survey
Equity allocations fell to their lowest level in almost two years in July, according to the latest AAII Asset Allocation Survey. Cash allocations, meanwhile, continued to rise to their highest level in more than two years.
Stock and stock fund allocations decreased by 0.6 percentage points to 64.0%. This was the smallest exposure to equities since November 2020 (63.2%). However, the decrease was not small enough to keep equity allocations from staying above their historical average of 61.5% for the 26th consecutive month.
Bond and bond fund allocations decreased by 0.4 percentage points to 13.7%. Bond and bond fund allocations are below their historical average of 16.0% for the 17th consecutive month.
Cash allocations grew by 1.1 percentage points to 22.3%. Cash exposure was last higher in April 2020 (23.0%). Even with the increase, July was the 27th consecutive month that cash allocations have been below their historical average of 22.5%.
Although optimism among individual investors about the short-term direction of the stock market in our weekly Sentiment Survey rose throughout most of July, it continued to remain well below its historical average. At the same time, pessimism largely stayed at unusually high levels.
- Stocks and Stock Funds: 64.0%, down 0.7 percentage points
- Bonds and Bond Funds: 13.7%, down 0.4 percentage points
- Cash: 22.3%, up 1.0 percentage points
- Stocks: 31.1%, up 0.4 percentage points
- Stocks Funds: 32.9%, down 1.1 percentage points
- Bonds: 3.4%, up 0.0 percentage points
- Bond Funds: 10.4%, down 0.4 percentage points
- Stocks/Stock Funds: 62.0%
- Bonds/Bond Funds: 16.0%
- Cash: 22.0%
Take the Asset Allocation Survey.
July 28, 2022 Fed Rate Hikes and Economic Hard Landings
July 21, 2022 Small-Cap Stocks Are Still on Sale
July 14, 2022 10 High-Yielding Stocks With Risky Dividends
July 7, 2022 Five Bear Market Moves for Tax-Savvy Investors

Discussion
Barry from TX posted over 4 years ago:
Two sentences stand out. (1) "The return gap (aka “the behavior gap”) is attributable to the TIMING of the buy and sell decisions made by investors," and (2) “Part of the reason for this large underperformance is tied to how investors REACT to volatility." The point of the article seems to be that investors are their own worst enemies because they sell and buy rather than buy and hold. The performance deficits are due to "reaction time" asymmetries, the techie personality side of today’s Mr. Market. By the time an individual investor reads about something that motivate a buy or sell behavior, the information that they are acting on is already "old news." Yeah, I know some of us think we are Quick Draw McGraw. But consider the time of the smallest segment in a buy/sell time decision line. Let's parse the buy/sell trading cycle. (1) You read (WSJ or an email) or heard/see (on Fox News) something that makes you want to buy or sell. That's "the decision time" part of a buy/sell event. (2) Next you have to navigate the "transaction time" part of the buy/sell event. Most of us will have to log on to our broker's website and then navigate its buy/sell page by entering the ticker symbol, number of shares and the transaction parameters (buy, sell) and (market, limit , etc.) and them poof you request on the verify screen, and then, and only then, click your mouse to execute the transaction. If this timeline does not sound very long to you, consider the length of its shortest step. A mouse click takes about a quarter of a second (250 milliseconds) for your brain to process your intent to right click the mouse button. It receives inputs and creates neurological impulses that make it possible to move the correct finger to press the mouse button. In that same 250 milliseconds (while you are clicking a mouse), supercomputers at hundreds of trading floors have already completed several thousand trades AHEAD of your click. The morals are: #1 Move all that lost time up front to a carefully researched and planned buy/sell decision. #2 Planned buy and hold strategies can nullify the asymmetry of all those supercomputers that operate in nanoseconds. And you get to keep that 2% edge you traded away by not planning and holding.
You need to log in as a registered AAII user before commenting.
Create an account