

Three Signals for When to Buy Stocks During Market Drops
by Charles Rotblut | August 08, 2024
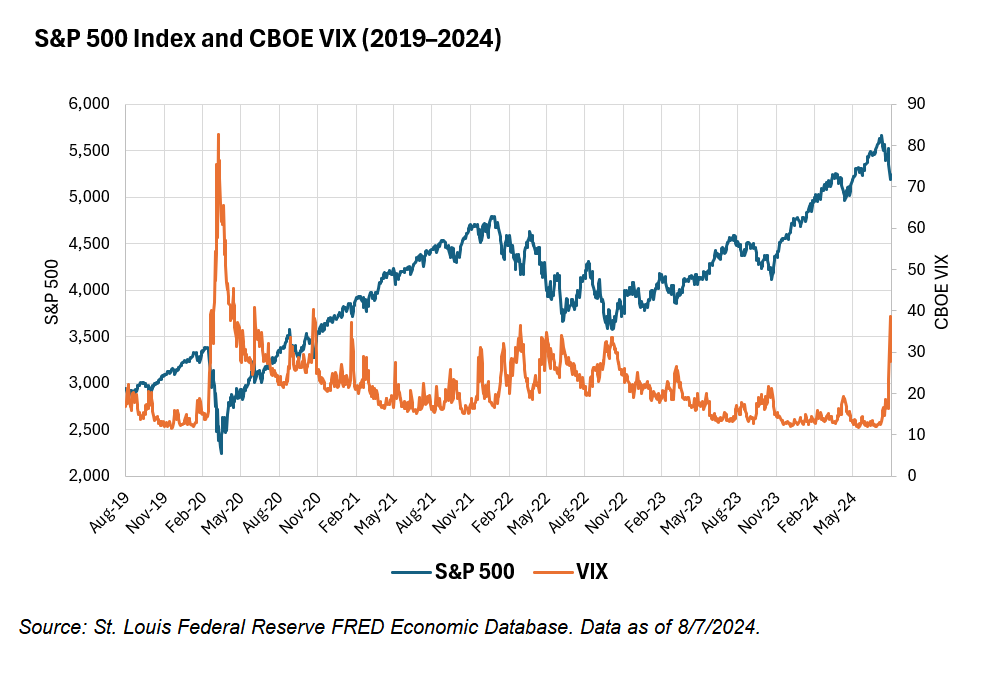
Bouts of downside volatility like we recently experienced can provide opportunities for bargain-hunting investors. Such investors include those of you who either purposely set aside cash to take advantage of market downturns and/or have new cash to put to work.
Defining a bargain price ultimately depends on valuation characteristics and fundamental traits. Market characteristics and expectations for the macroeconomic environment also play a role. Both apply to individual stocks as well as to exchange-traded funds (ETFs) and mutual funds—particularly those benchmarking a broad index.
Either way, there are a few stock market indicators for determining whether the odds favor opening your wallet and looking for bargains. Here are three that are easy to find or calculate.
VIX at One Standard Deviation or More Above Average: This is one indicator I saw being discussed following last Friday’s market drop. Buying opportunities have historically occurred when the Chicago Board Options Exchange’s (CBOE) Volatility index (aka the VIX) rises one or more standard deviations above its historical average. The VIX uses S&P 500 index options prices to measure the market’s estimate of expected volatility in the S&P 500.
Research firm DataTrek says the VIX’s average daily closing level since 1990 is 19.5, with a standard deviation of 7.9 points. This makes the VIX closing values of 27.4, 35.3 and 43.2 equivalent to one, two and three standard deviations above average.
A VIX level exceeding two standard deviations is a reading that ranks in the highest 2.5%. Such levels have mostly occurred in response to macroeconomic shocks, such as the first Gulf War, the September 11 terrorist attacks, the global financial crisis and the coronavirus pandemic. The VIX most recently closed above this threshold on Monday, August 5, 2024, ending the day at 38.57. (A VIX reading that is two standard deviations below average would rank in the lowest 2.5%.)
The S&P 500 Falls by a 7% Threshold: Declines in the S&P 500 in the magnitude of seven-percentage-point thresholds—meaning 7%, 14%, 21%, 28%, etc.—have been good buying opportunities. Sam Stovall of CFRA Research says those who have used this rule to go bargain hunting for investments or put cash to work in the stock market would have looked like terrific market timers.
History backs him up. The average post–World War II pullback has bottomed at a decline of 7%. The average correction has bottomed at 14%. The average bear market has bottomed at a loss of 33% with the typical garden variety bear market falling by 27%. The S&P 500 ended Monday down 8.5% from its record high.
A Break Above the 200-Day Moving Average: The 200-day moving average is a long-term trend line. Drops below it are considered bearish, while breakouts above it are bullish.
University of Pennsylvania professor Jeremy Siegel found that rotating out of large-cap stocks when the S&P 500 drops below its 200-day moving average and then getting back into stocks when the index rises back above its 200-day moving average works. There is a reduction in returns relative to a buy-and-hold strategy but volatility is lower. Plus, it avoids most bear markets. Investors seeking to put cash to work can use breaks above this trend line as a sign to open their wallets and purchase stocks at bargain prices.
The S&P 500 has remained above its 200-day moving average since last breaking above it in November 2023. Currently, the 200-day moving average is at approximately 5,170.
None of these rules can guarantee that you will buy stocks or ETFs at or near the market’s bottom. But they are quantifiable and easy-to-follow guidelines to have ready the next time the opportunity arises to go bargain hunting for stocks.

-
Stock Market Retreats and Recoveries
Sam Stovall reveals that only six months, on average, have separated the end of one decline and the start of the next one, but recoveries have been quick. -
Real Returns Favor Holding Stocks
Jeremy Siegel discusses why stocks are good hedges against inflation, preserve purchasing power and, over long periods, are less risky than bonds. -
Spotting Value on the Move With the PEG Ratio
The August 2024 AAII Journal shows how to avoid the value trap with screens that isolate reasonably priced stocks exhibiting earnings growth and price appreciation. -
Under Budget and Overwhelmed: Real Talk on My No-Buy Year Journey
In her latest My Investing Discoveries blog post, Anine Sus updates her budget and reviews how the no-buy year has influenced her spending so far.
AAII Sentiment Survey
Bearish sentiment among individual investors about the short-term outlook for stocks increased in the latest AAII Sentiment Survey. Meanwhile, both optimism and neutral sentiment decreased.
Bullish sentiment, expectations that stock prices will rise over the next six months, decreased 4.3 percentage points to 40.5%. Bullish sentiment is above its historical average of 37.5% for the 39th time in 40 weeks.
Neutral sentiment, expectations that stock prices will stay essentially unchanged over the next six months, decreased 7.9 percentage points to 22.0%. Neutral sentiment is now unusually low and is below its historical average of 31.5% for the fifth consecutive week.
Bearish sentiment, expectations that stock prices will fall over the next six months, increased 12.3 percentage points to 37.5%. Bearish sentiment is above its historical average of 31.0% for the second time in nine weeks.
The bull-bear spread (bullish minus bearish sentiment) decreased 16.6 percentage points to 3.1%. The bull-bear spread is below its historical average of 6.5% for the first time in 14 weeks.
This week’s special question asked AAII members what they thought about the Federal Reserve’s decision to keep interest rates unchanged.
Here is how they responded:
- It was the right decision: 48.5%
- They should have cut rates: 33.8%
- They should have raised rates: 8.9%
- No opinion/not sure: 8.4%
Bullish: 40.5%, down 4.3 points
Neutral: 22.0%, down 7.9 points
Bearish: 37.5%, up 12.3 points
Bullish: 37.5%
Neutral: 31.5%
Bearish: 31.0%
See more Sentiment Survey results.

AAII Asset Allocation Survey
Individual investors’ allocations to equities decreased slightly in the July Asset Allocation Survey.
Stock and stock fund allocations decreased 0.4 percentage points to 70.1%. Stock and stock fund allocations are above their historical average of 61.5% for the 50th consecutive month.
Bond and bond fund allocations are unchanged at 14.5%. Bond and bond fund allocations are below their historical average of 16.0% for the sixth consecutive month.
Cash allocations increased 0.4 percentage points to 15.4%. Cash allocations are below their historical average of 22.5% for the 20th consecutive month.
- Stocks and Stock Funds: 70.1%, down 0.3 percentage points
- Bonds and Bond Funds: 14.5%, up 0.0 percentage points
- Cash: 15.4%, up 0.3 percentage points
- Stocks: 33.8%, down 0.8 percentage points
- Stocks Funds: 36.4%, up 0.5 percentage points
- Bonds: 4.7%, down 0.4 percentage points
- Bond Funds: 9.8%, up 0.4 percentage points
- Stocks/Stock Funds: 62.0%
- Bonds/Bond Funds: 16.0%
- Cash: 22.0%
Take the Asset Allocation Survey.
August 1, 2024 Avoid These Costly Retirement Account Rollover Mistakes
July 25, 2024 July Charts of Interest: The Small-Cap Stock Resurgence
July 18, 2024 Chasing Super High Yields Can Burn Your Portfolio
July 11, 2024 Balancing Longevity Risk With Late-in-Life Care Expenses

Discussion
John L from NJ posted over 2 years ago:
"Bargain-hunting investors" - More accurately known as speculators attempting to time the market. This is definitely not a good idea.
Barry from TX posted over 2 years ago:
Charles, the deftness of your Karl Wallenda imitation by trying to walk the high-wire across the deep chasm from the safety of the core AAII “buy and hold” catechism to the possibility that “trend following” using a 200-day moving average to “time the market” was stunningly spellbinding. You got to the other side without falling, but I am not sure that some of the faithful AAII B&H believers made it across with you. Opening the door a crack may have some slamming the door in your face in the future. Previously, AAII has laid bare the limitations of the 60/40 portfolio and the inherent downside in diversification. Now you tell us not only that market timing works, but it is simple to do. The Sam Stoval and Dr. Jeremy Siegel articles referenced were fascinating. Those and this one compelled me to learn more. I found two articles in the AAII database that add to this topic: (1) Buy-and-Hold Versus Market Timing Journal ? Technical Analysis ? Wayne A. Thorp ? July 2010 A look at Theodore Wong’s research into building a moving average crossover system and testing it against a buy-and-hold approach. Wayne did a great job here explaining a similar, but more detailed approach to making market timing work. (2) Can Investment Newsletters Successfully Time the Market? Journal ? Feature ? Mark Hulbert ? April 1999 Investment Newsletters: Most market timers do reduce stock market risk, although often the expense is lower returns. A smaller, but not insignificant, number of market timers beat the market on a risk-adjusted basis over the long term. This article was less convincing because it merely summarizes mark timing attempts over a very short period. Thanks for educating me, Charles.
Madison1782 from TN posted over 2 years ago:
Is there a symbol for any of the 50/100/200 Day moving averages?
Barry from TX posted over 2 years ago:
Charles's article here helps provide perspective. I am enclosing a "gift link" to Jason Zweig's "Intelligent Investor" WSJ column from 8/9/24 which provides comparative data (a key habit to develop perspective) and highlights the importance of asking, what is the denominator for the percentages provided? Here's the link: https://www.wsj.com/finance/investing/how-to-stay-sane-when-markets-get-wild-bf662935?st=m43llncyoxjdku9&reflink=desktopwebshare_permalink
Charles Rotblut from US-0-IL posted over 2 years ago:
Madison1782,
You can see the moving averages for stocks and ETFs on the "Charts" tab on the evaluators for either. Just type the ticker symbol or name into the search box near the top of most pages. Then click on "Charts". Once the chart appears, click on the "Indicators" box to overlay the moving averages on the chart.
Barry from TX posted over 2 years ago:
Charles, as your article suggests, using 200DMAs as a market signaling and tracking device to make buy/sell decisions during market changes is well-supported and widely used by skilled investors with higher skills and resources. This article references an AAII Oct 2017 article by Sam Stoval of CFRA Research, "Real Returns Favor Holding Stocks." In July 2014, you interviewed Dr. Jeremy Siegel of Wharton soon after he published the 5th Ed of his very popular book, "Stocks for the Long Run." Both articles make the case that markets HAVE ALWAYS recovered and they do so in relatively short periods depending on the relative severity of the "drawdown.” The data in these resources reinforce how a "buy on the dip" strategy using market signals like the 200DMA can produce the returns expected and how long it takes to expect to recover on average.
Charles Rotblut from US-0-IL posted over 2 years ago:
Barry,
I did see Jason's column last week. I don't view these indicators as market timing so much as putting money to work when the odds are more favorable. I wouldn't advocate for waiting for them to occur with a significant amount of money because of the length of time the market can rise between such opportunities appear. But there are times when cash accumulates in a portfolio or people have excess cash they are willing to put to work when the market pulls back. These indicators can be helpful in such situations.
-Charles
Rob from NC posted over 2 years ago:
The "rules" presented in this article are silly. They assume that in the short-term future, the market will behave in a predictable manner based on its past movements. You might as well use tea leaves. Make no mistake, I'm all for scooping up bargains when they appear, but setting arbitrary buy/sell rules based on particular market percentages or standard deviations is a fool's game.
Rob from NC posted over 2 years ago:
Some perhaps better rules: Buying after a 5% market downturn is good. Buying after a 10% market downturn is better. Buying after a 15% downturn is even better. Buying after a 50% downturn is outstanding! Unfortunately, NOBODY knows where the market will be next week, next month, or next year, so does one wait on the 50% downturn that may never come? If I wait for Sam's 7% downturn, what happens to me if the market declines by 6% and then shoots up, never to see such a low level again? So maybe I wait for a 6% decline, but then the next market bottom could be 5%---and so on, and so on. Any such "rule of thumb" becomes absurd.
Rob from NC posted over 2 years ago:
If you buy and hold a good stock for 20 years, the fact that you paid a 10% premium for it will be inconsequential. In my humble opinion, it's much better to exercise reason and judgment in your market activities than it is to apply arbitrary rules based on market "signals." "Never be so wise that you forget to think."
Richard from UT posted over 2 years ago:
Charles - thanks for a great article! I found it enlightening. Market Pullbacks, Corrections and Bear Markets occur because fundamental conditions have changed (as you pointed out). When conditions change everyone seems to behave in the same way, and culls their underperforming positions. With higher interest rates, the high PEs of those growth companies don't look so good. After selling your underperforming companies, if you begin moving into new companies too soon - before the underlying conditions have changed, you will be disappointed. This provides historical guidance about how to think about the buying opportunity presented. Thanks again.
steve kalish from Maryland posted over 2 years ago:
Are there any formal papers that use back testing to determine if the SMA approach is ever accurate?
You need to log in as a registered AAII user before commenting.
Create an account