

October Charts of Interest: Happy Second Birthday, Bull Market
by Charles Rotblut | October 17, 2024
The current bull market marked its second anniversary over the weekend, so I start by sharing data on what has historically happened next. I then share charts about Social Security, America’s aging population and big delays at TreasuryDirect. Let’s go.
The S&P 500 index realized a 33.7% return over the past 12 months through Friday, October 11. If historical patterns repeat, the next 12 months could be bumpy. In a note sent out on Monday, CFRA Research’s Sam Stovall observed that “11 bull markets that celebrated their second birthday experienced at least one decline of 5% or more in the subsequent 12 months, while some endured more and became new bear markets.”
Here’s what the S&P 500 has experienced during its third year of a bull market.
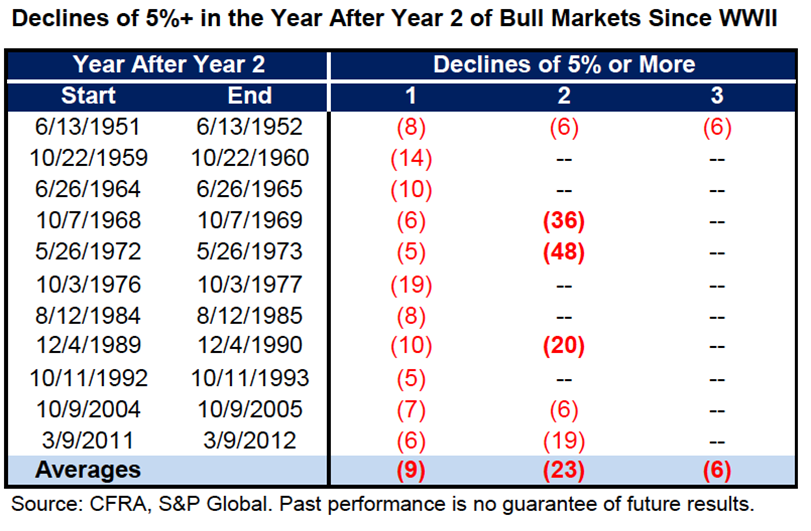
Stovall elaborated on the table: “The average return following the 11 bull markets that celebrated their second birthday was a mere 2.0% (5.2% if one excludes those that became bear markets before the third year was out). What’s more, all experienced a decline of 5%, while five endured sell-offs in excess of 10% but less than 20%, and three succumbed to new bear markets. Despite this unsettling intra-year volatility, three bulls posted double-digit gains.”
Bull Markets Can Hang Around
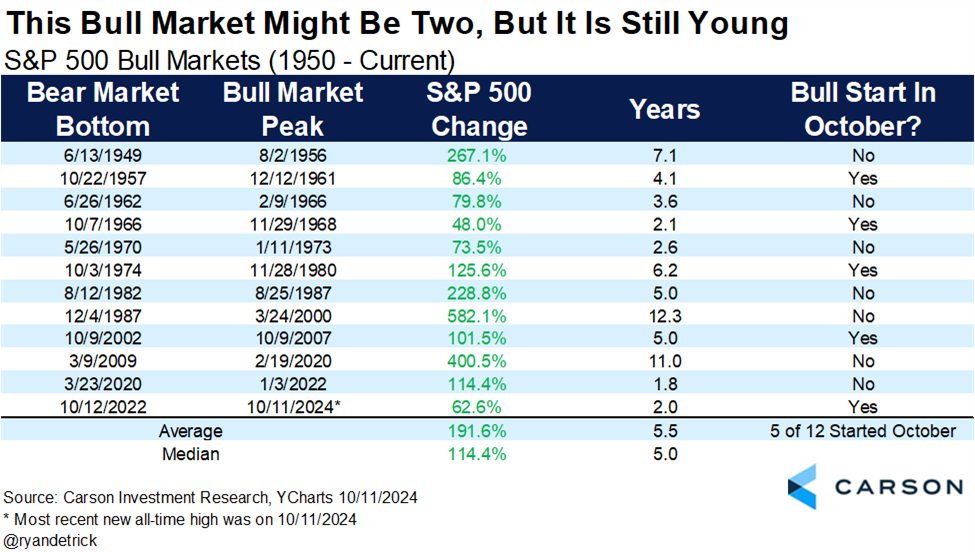
The average bull market has lasted 5.5 years, as this table from Carson Group’s Ryan Detrick shows. The variance is quite large though, ranging from two to 12 years.
It’s Been a Large-Cap Party
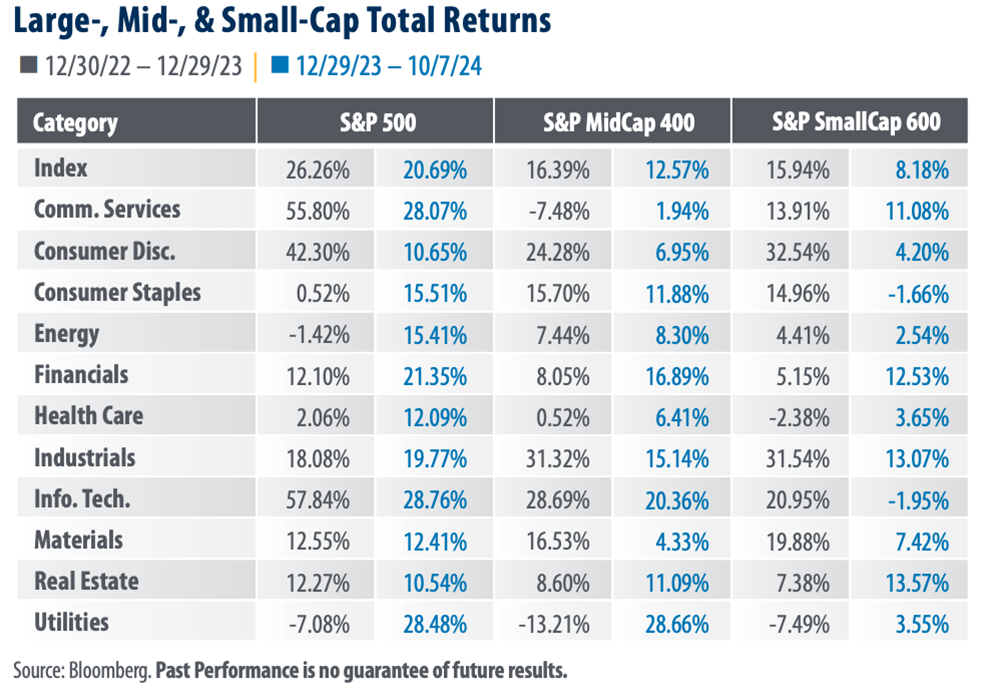
Sector performance has mostly been best at the large-cap level over the past two years. It has also mostly been worse at the small-cap level. The performance gaps are most notable in the communication services and information technology sectors.
First Trust Portfolios’ Robert Carey, CFA, and Peter Leonteos say the outperformance in large-cap stocks has caused lopsidedness in the S&P 1500 index. Combined, the S&P SmallCap 600 index and the S&P MidCap 400 index comprised just 8.1% of the total market capitalization of the S&P 1500 as of September 30, according to Carey and Leonteos. Prior to the coronavirus pandemic, the last time that small and mid-sized companies accounted for 8.1% or less of the S&P 1500’s market cap was April 28, 2000.
An Average Increase in Social Security Benefits
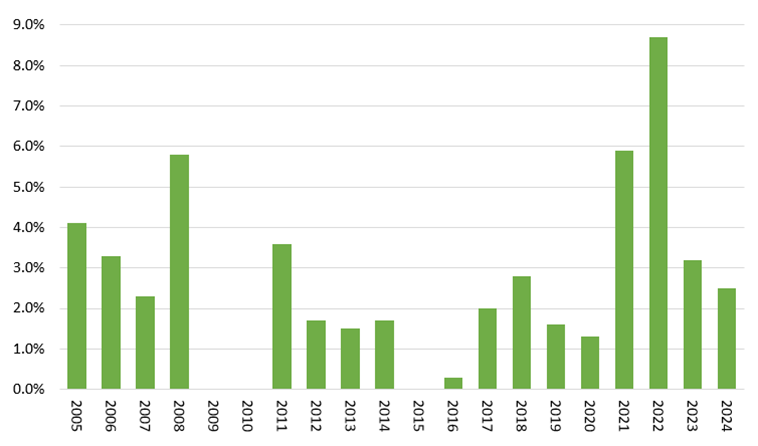
Social Security benefits for retirees will rise 2.5% in 2025. This is very close to the 20-year average increase. The annual change is based on the third-quarter 2024 change in inflation year over year. Technically, it is the increase from the third-quarter of the prior year to the third quarter of the current year in the consumer price index for urban wage earners and clerical workers (CPI-W). As always, the Social Security Administration’s (SSA) inflation gauge may not match the price increases on the goods and services you buy.
Annual Social Security Cost of Living Adjustments (2005–2024)
Source: Social Security Administration.
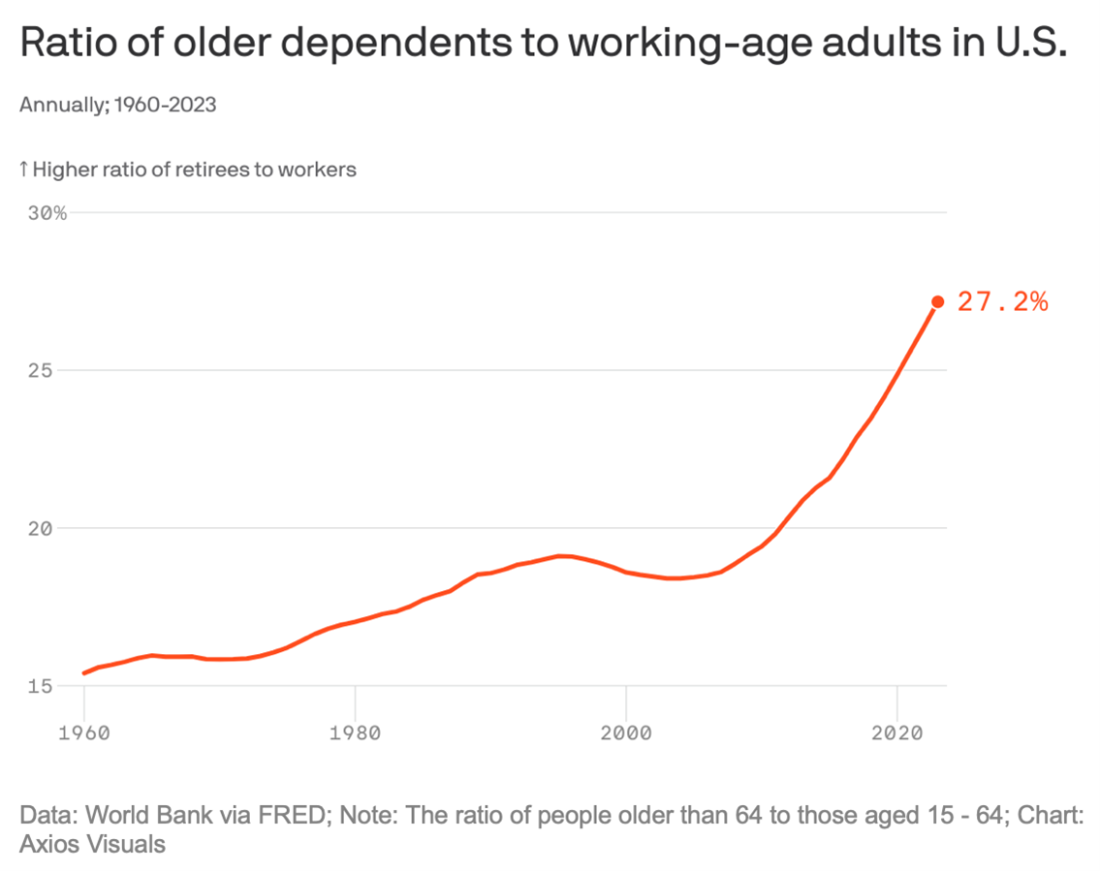
The U.S. Continues to Get Older
A trend facing developed countries, including the U.S., is a rising age dependency ratio. This ratio compares the number of older adults (people older than 64) to the working-age population (those ages 15 to 64). Not only does it impact the economy and how people work, it also impacts care. The higher the ratio, the fewer caretakers there are to help those who need their assistance.
A Big Slowdown at TreasuryDirect
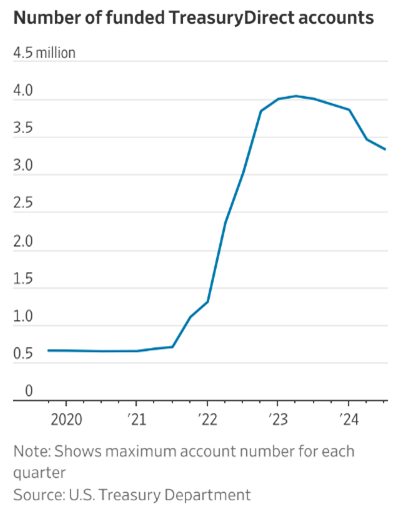
If you bought Treasury bonds through TreasuryDirect and want to transfer them out, be sure you possess a large dose of patience. “People who want to move investments from their accounts on the [U.S. Department of the Treasury’s] website to their brokerage accounts may have to wait as long as a year,” notes The Wall Street Journal. The delay is due to the large number of new accounts opened following the jump in bond yields in 2022, including Series I bonds.
Make sure you have your username, password and correct bank information. On the website, the Department of the Treasury says that “unlocking your TreasuryDirect account or updating your banking information within that account” may take two weeks.

-
Large-Cap Stocks' Rally Rooted in Artificial Intelligence
The S&P 500 index’s strong performance for the first half of 2024 is attributable to its technology-related stocks. -
Using Portfolio Returns to Determine When to Claim Social Security Benefits
Upon reaching full retirement age, a retiree can look back at the performance of their nest egg portfolio to determine whether to claim immediately or wait until credits for delayed claiming stop. -
Looking to Lakonishok for Latent Gems
The October 2024 AAII Journal looks at a screening approach based on finding out-of-favor companies that are beginning to show signs of awakening.
AAII Sentiment Survey
Bearish sentiment among individual investors about the short-term outlook for stocks increased in the latest AAII Sentiment Survey. Meanwhile, both optimism and neutral sentiment decreased.
Bullish sentiment, expectations that stock prices will rise over the next six months, decreased 3.6 percentage points to 45.5%. Bullish sentiment is above its historical average of 37.5% for the 49th time in 50 weeks.
Neutral sentiment, expectations that stock prices will stay essentially unchanged over the next six months, decreased 1.3 percentage points to 29.2%. Neutral sentiment is below its historical average of 31.5% for the 15th consecutive week.
Bearish sentiment, expectations that stock prices will fall over the next six months, increased 4.8 percentage points to 25.4%. Bearish sentiment is below its historical average of 31.0% for the ninth time in 10 weeks.
The bull-bear spread (bullish minus bearish sentiment) decreased 8.4 percentage points to 20.1%. The bull-bear spread is above its historical average of 6.5% for the 23rd time in 24 weeks.
This week’s special question asked AAII members how they would describe the current valuation of stocks.
Here is how they responded:
- Stocks, in general, are overvalued: 48.7%
- Stocks, in general, are fairly valued: 12.1%
- Valuations are mixed, with some stocks expensive and others cheap: 34.5%
- Stocks, in general, are undervalued: 2.6%
- Not sure/no opinion: 1.7%
Bullish: 45.5%, down 3.6 points
Neutral: 29.2%, down 1.3 points
Bearish: 25.4%, up 4.8 points
Bullish: 37.5%
Neutral: 31.5%
Bearish: 31.0%
See more Sentiment Survey results.

October 10, 2024 The Lessons We Learned From Caregiving and Estate Settlement
October 3, 2024 Our New Data Feed and Its Impact on Your Investments
September 26, 2024 A Snapshot of Current Stock Valuations
September 19, 2024 September Charts of Interest: Rate Cut Edition

Discussion
Barry J from TX posted almost 2 years ago:
Charles, thanks for adding a roller-coaster ride to your traveling circus of Charts of Interest. #1 Before anyone screams as we begin one of the downhill segments on our fun-filled ride, it’s important to compare Stovall’s data points to the overall base rates. Using his best known experiment, the “Lucy Problem” [Thinking, Fast and Slow, 2011, p.156] Dan Kahneman showed that failure to consider base rates for any statistics you are given caused over 85%-89% of college-educated subjects to make erroneous conclusions because they failed to consider that the data they were given violated the logic of probabilities and they accepted the first believable story their brains accepted as plausible. Please note that Stovall’s table omits years with POSITIVE returns for the 3rd , 4th, and 5th years after the 11 2-year bull markets listed AND we ignore that the average SPX return (since its launch in 1957) for ALL (43+24 = 77) SPX years is 8%-10% (the base rate) depending on whose back-testing data you prefer. #2 A large-cap tilt is part of the long-term cycle of marker leadership rotations. Craig Israelsen recently published a quit chart showing this phenomenon on AAII. 3Q24-4Q24 may be as thrilling as the Six Flags Great Adventure's in Jackson NJ Kingda Ka 45-story roller coaster drop. #3 Now that we have survived the market roller coaster, we stroll the Sideshow Freak Shows that are federal government policies "to help you." #4 The Invisible Man exhibit is 2.5% SSI increase. The reason for concern to retirees living off SSI and the returns for their portfolios in 2025-2027 is that the base rate here is the lower residual increase after the SSI bump is “redirected” to fund higher Medicare costs leaving a smaller YOY increase to fund living although higher inflation continues unabated. #5 The next Freak Show on the Midway is the Hall of Mirrors where the number of retirees grows and the number of workers grows smaller. Productivity is the only way to exit this sideshow, but AI is NOT the answer. but is becoming yet another problem that will distort REAL GDP productivity. #6 TreasuryDirect’s continuing inability to no get its act is a Freak Show unto itself that truly amazes me. The UST curators spends more time trying to convince patrons that the base rate that “is what it is” and not a Sideshow that “is what it is.” Ring Master Charles, you have outdone yourself. It’s time to roll on to the next stop in November and put up your Big Tent of Amazing Anomalies for Bajkowski's & Rotblut’s Independent Investors (AAII) traveling carnival again. Fire up the steam calliope and bring in the dancing pachyderms.
You need to log in as a registered AAII user before commenting.
Create an account