

A Snapshot of Current Stock Valuations
by Charles Rotblut | September 26, 2024
Our A+ Investor Value Grade uses percentile rankings to determine how cheap or expensive a stock is. Stocks are ranked based on whether they are cheap or expensive relative to all other stocks. The score underlying each grade is a composite ranking of up to six valuation ratios, including the price-earnings (P/E) ratio or the price-to-book-value (P/B) ratio.
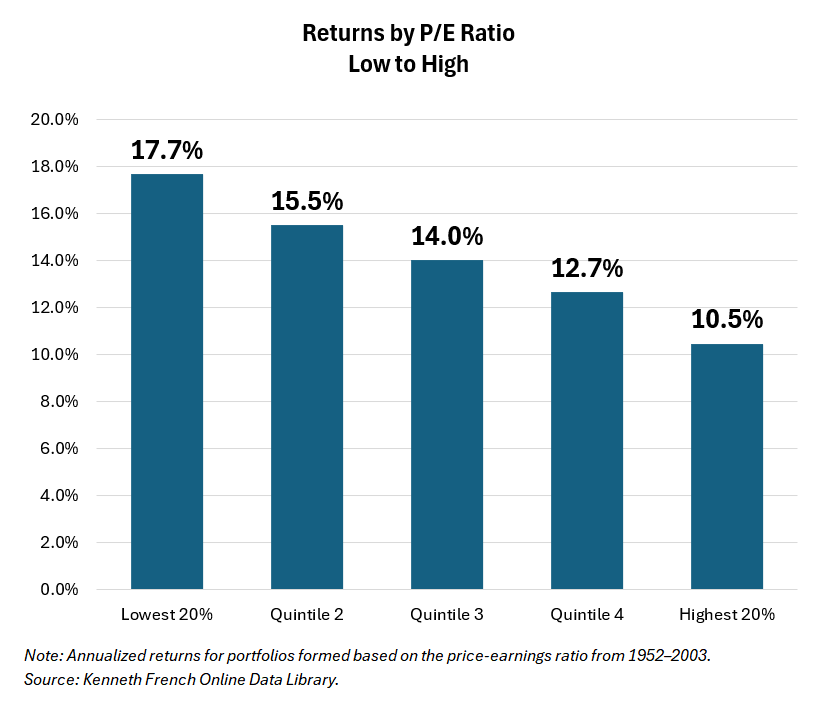 The Value Grade has its basis in academic research. Datasets, like those provided by Dartmouth professor Kenneth French, make use of percentile rankings to determine what factors work. The data shown in this week’s chart, for instance, shows the long-term returns of portfolios composed of stocks from different valuation quintiles. The stocks in each of the chart’s quintiles are grouped based on their relative price-earnings ratios. (Technically, French inverts the ratio to earnings to price, but the results are the same: Cheap outperforms expensive.)
There are two advantages to relative valuations. The first is that they allow you to make comparisons across many stocks. This is helpful when you are trying to identify how attractive a stock is given the prevailing market conditions.
Secondly, relative valuations make it easier to find both potential investments and ones to avoid. There will always be stocks whose price-earnings ratios rank in the cheapest 20% and stocks whose price-earnings ratios rank in the priciest 20%, regardless of what their absolute price-earnings ratios are.
With this in mind, here is an updated look at the average valuation ratios underlying our A+ Investor Value Grade. (All data is from AAII’s Stock Investor Pro and LSEG Data & Analytics as of September 20, 2024.)
Price to Sales
The price-to-sales (P/S) ratio is determined by dividing market price per share by the sales per share for the most recent 12 months. Seeking undervalued stocks based upon the price-to-sales ratio was first popularized by Kenneth Fisher in his book “Super Stocks” (McGraw-Hill, 1984).
Proponents of the price-to-sales ratio argue that earnings-based approaches to selecting stocks are inferior because earnings are influenced by many management assumptions trickling through the accounting books. The price-to-sales ratio can provide a meaningful valuation tool when negative earnings render earnings-based models useless.
While price-to-sales ratios of below 1.0 have traditionally been viewed as indicating cheaply valued stocks, most stocks currently trade with ratios above 1.0.

Price to Earnings
The price-earnings ratio, or earnings multiple, is one of the most popular measures of company value. It is computed by dividing the current stock price by earnings per share for the most recent four quarters.
The price-earnings ratio is followed by so many because it relates the market’s expectation of future company performance—embedded in the price component of the equation—to the company’s recent earnings performance. The greater the expectation for future growth, the higher the multiple of current earnings investors are willing to pay. However, there is no guarantee that these expectations will be met, making stocks with high price-earnings ratios risky.
While the price-earnings ratio for the market-capitalization-weighted S&P 500 index is high (28.4), there are still many companies trading with price-earnings ratios of under 20.0.

Enterprise Value to EBITDA
The ratio of enterprise value to earnings before interest, taxes, depreciation and amortization (EBITDA) is determined by dividing enterprise value for the most recent quarter by EBITDA for the most recent 12 months. Enterprise value is a company’s market value of equity (including preferred stock) plus its interest-bearing debt minus excess cash.
Some investors feel that a company’s enterprise value relative to its EBITDA is a better way to measure company value than the price-earnings ratio alone. The ratio is neutral to the company’s capital structure and capital expenditures (capex). EBITDA is an approximation of cash flow but is not actual cash flow.

Shareholder Yield
A stock’s shareholder yield—the sum of its buyback yield and dividend yield—shows the percentage of total cash a company is paying out to its shareholders, either in the form of a cash dividend or as expended cash to repurchase its shares in the open market. Thus, if a company is paying a 2% dividend yield and has a 3% buyback yield, its shareholder yield would be 5%.
Unlike other valuation measures, shareholder yield is inversely related to value, with higher shareholder yields implying lower valuations. A negative shareholder yield occurs when the percentage increase in the number of shares outstanding is greater than the stock’s dividend yield.

Price to Book Value
The price-to-book ratio is calculated by dividing the share price by book value per share. Book value is generally determined by subtracting total liabilities from total assets. It represents the value of the shareholder’s equity based upon historical accounting decisions.
The price-to-book ratio was a favorite measure of Benjamin Graham and his disciples who sought companies with a share price below the book value per share.
Small companies have been trading at historically low price-to-book ratios relative to large companies over the past few years. Because there are more small exchange-traded companies than large ones, the lowest quintile and median price-to-book values are both much lower than the highest quintile.

Price to Free Cash Flow
The price-to-free-cash-flow (P/FCF) ratio is calculated by dividing the share price by free cash flow per share for the most recent 12 months. Cash flow is reported on the cash flow statement. It is the sum of cash from operations, cash from investing and cash from financing adjusted for exchange rate effects. Free cash flow is calculated by subtracting capex and dividend payments from cash flow from operations.
The cash flow statement is harder to manipulate through accounting techniques than earnings. Unlike earnings, which are an accounting figure, cash flow represents the net total of cash flowing into and out of the company over a given period.
The higher the ratio, the more free cash investors expect a company to generate in the future—and the more potential downside.


-
Understanding AAII's Revised Value Grade
Read more about AAII’s Value Grade for stocks and how you can use it to help judge which stocks are potential bargains and which are expensive. -
Shareholder Yield Works on Wall Street as a Value Measure
Faber’s shareholder yield approach has the potential benefit of investing in classic value companies that are also buying back their stock and reducing their debt. -
Using Vanguard Funds and ETFs for Your Asset Allocation Needs
The September 2024 AAII Journal shows the variety of mutual funds and ETFs offered by Vanguard that can fit AAII’s Asset Allocation Models.
AAII Sentiment Survey
Neutral sentiment among individual investors about the short-term outlook for stocks increased in the latest AAII Sentiment Survey. Meanwhile, optimism and pessimism decreased.
Bullish sentiment, expectations that stock prices will rise over the next six months, decreased 1.2 percentage points to 49.6%. Bullish sentiment is unusually high for the second consecutive week and is above its historical average of 37.5% for the 46th time in 47 weeks.
Neutral sentiment, expectations that stock prices will stay essentially unchanged over the next six months, increased 3.9 percentage points to 26.7%. Neutral sentiment is below its historical average of 31.5% for the 12th consecutive week.
Bearish sentiment, expectations that stock prices will fall over the next six months, decreased 2.7 percentage points to 23.7%. Bearish sentiment is below its historical average of 31.0% for the sixth time in seven weeks.
The bull-bear spread (bullish minus bearish sentiment) increased 1.5 percentage points to 25.9%. The bull-bear spread is above its historical average of 6.5% for the 20th time in 21 weeks.
This week’s special question asked AAII members about their thoughts on the Federal Reserve’s decision to cut interest rates by 0.50 percentage points.
Here is how they responded:
- It was the right move: 57.3%
- They should have cut rates by a smaller amount: 29.0%
- They should have left rates unchanged: 6.5%
- They should have cut rates by a large amount: 0.8%
- Not sure/no opinion: 6.5%
Bullish: 49.6%, down 1.2 points
Neutral: 26.7%, up 3.9 points
Bearish: 23.7%, down 2.7 points
Bullish: 37.5%
Neutral: 31.5%
Bearish: 31.0%
See more Sentiment Survey results.

September 19, 2024 September Charts of Interest: Rate Cut Edition
September 12, 2024 Excess CAPE Yield Low Ahead of Potential Interest Rate Cut
September 5, 2024 A Rebound in the Number of Stocks, but Share Prices Rise More
August 29, 2024 The Advantages of Combining Momentum and Equal Weighting

Discussion
Barry J from TX posted over 2 years ago:
Charles, the “Returns by P/E Ratio “ table provides data that supports the value of the AAII quintile ranked grading system. This is something I have always wondered about. Returns improve across all intervals – from 10.5, to 12.7, to 14.0, to 15.5, to 17.7 -- AND the rate of improvement increases by each interval by 1.2, by 1.3, by 1.5 and by 2.2. The total change across this range is that stocks with the lowest P/Es (Q1) return 59% more than stocks with the highest P/Es (Q5). My personal preference is to reweight the letter grades from equal weights to a geometric weighted system. I use 0, 1, 3, 5, 10 to get higher discrimination when selecting investment candidates. Similarly, geometrically weighted scales were used by Hosin Kanri and Six Sigma to increase discrimination. These geometric differentiations have improved my screening process over time because they sort out and reduce the number of alternatives to a more manageable set of choices. Research says people make poorer decisions (or just quit) when alternatives increase beyond 5-7 or so. Our working memory just gets overloaded, and analytical comparison processes become error prone OR just shut down AND we quit the comparison process. Thanks for this data, Now I have support for my intuitions and support for my suspicions. Of course, this could be an anomaly in the data. Perhaps AAII should publish these data (if it is not already available somewhere.) You get 1 attaboy. You are gaining on Wayne and Jenna.
You need to log in as a registered AAII user before commenting.
Create an account