

A Rebound in the Number of Stocks, but Share Prices Rise More
by Charles Rotblut | September 05, 2024
Featured Tickers: AZO
AZO
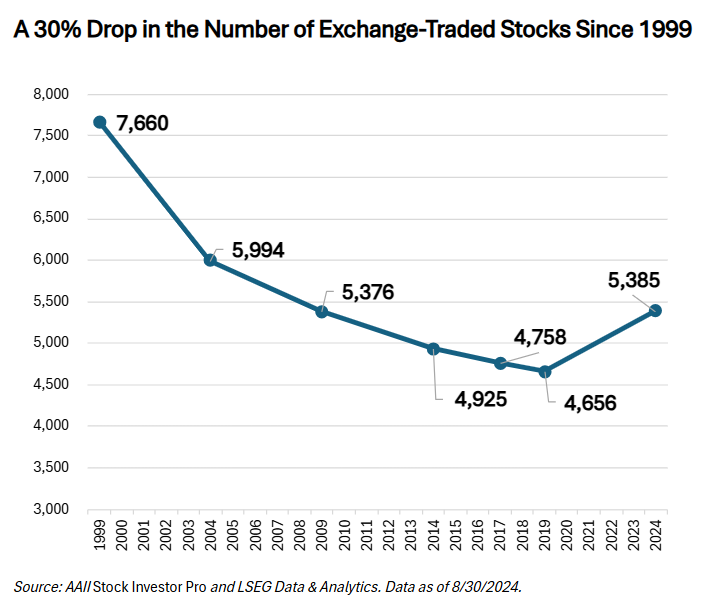
Prior to the coronavirus pandemic, there had been a two-decade decline in the number of exchange-listed stocks. Since 2020, there has been a rebound, though the absolute number of stocks is still down from December 1999. At the same time, the average share price of exchange-listed stocks has risen—with particularly big increases occurring over the past 10 years.
Before I discuss both trends in greater detail, I want to touch on the implications for individual investors.
There are currently 5,385 exchange-listed stocks. More than 70% are not included in the S&P 500, S&P MidCap 400 or S&P SmallCap 600 indexes. If you only limit yourself to stocks included in those major indexes, you will miss out on many potentially high-returning investment ideas.
One of the big advantages of being an individual investor is the ability to consider stocks of all market capitalizations, be they large or small. We think you should exploit this advantage. Doing so allows you to capture opportunities that institutional investors cannot.
Regarding stock prices, the average price of an exchange-listed stock is now $182.68. There are currently 15 stocks with share prices greater than $1,000. Even if we exclude the class A shares of Berkshire Hathaway (but still include all the stocks trading at less than $5 per share), the average exchange-listed stock price has risen.
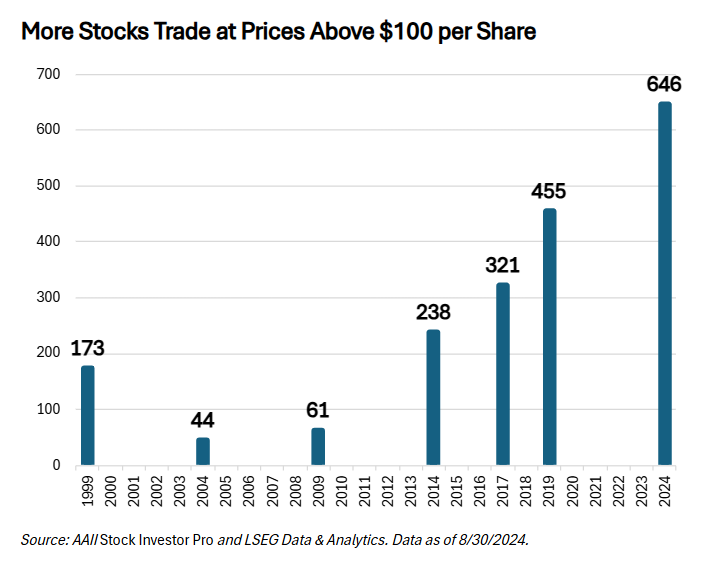
We only consider the rise in the average price per share to be an issue to the extent that an individual investor is unable to adequately diversify. Investors with smaller portfolios or smaller stock positions may find buying stocks like AutoZone Inc.  (AZO), which ended August at $3,181.48 per share, difficult.
One workaround is to buy fractional shares. Fidelity, Interactive Brokers LLC and Robinhood are among the brokers offering fractional share trading outright. Charles Schwab allows fractional share purchases for a limited number of stocks via its Stock Slices program. There are many other brokers not allowing any fractional share trades for stocks beyond automated dividend reinvestment, including E*Trade.
I’ve had good experiences buying fractional shares of exchange-traded funds (ETFs) through Fidelity. I do use limit orders and suggest you do as well. I’ve personally found fractional share purchases to work well with dollar-cost averaging.
The Drop and Rebound in the Number of Stocks
In 2017, I wrote about the then-shrinking number of exchange-listed stocks. The trend continued up to the spread of the coronavirus pandemic. There were nearly 40% fewer stocks listed on the major U.S. exchanges at the end of 2019 compared to the end of 1999 (4,656 versus 7,660).
This decline began to reverse in 2020 when there were 480 initial public offerings (IPOs). More companies went public in 2021, a year that featured 1,035 IPOs. The number of IPOs has not topped 400 during any other year this century, according to Statista. (The year 2000 came close with 397 IPOs.)
As of the end of August, there were 5,385 stocks listed on the major U.S. stock exchanges. Note that this is still 30% below the number of stocks that were listed at the end of 1999.
Beyond mergers, there continue to be companies opting to stay private. Some of these are hoping to eventually be acquired instead of going public. There has been a tendency for newer companies to spend more time maturing in the private market—thanks to available funding—rather than going public.

-
Online Discount Brokers: Comparing and Contrasting the Older and the New
Two major additions to the offerings of online brokers are fractional shares and cryptocurrency trading. -
Special Purpose Acquisition Companies (SPACs) Explained
With a SPAC, an investment firm raises cash from public investors with the goal of acquiring a private company to bring it public. -
Six Lessons of Investment Loss to Keep You Winning
The September 2024 AAII Journal features stories of investing loss that underscore the importance of preparation, vigilance and learning from others’ experiences.
AAII Sentiment Survey
Neutral sentiment among individual investors about the short-term outlook for stocks increased in the latest AAII Sentiment Survey. Meanwhile, optimism and pessimism decreased.
Bullish sentiment, expectations that stock prices will rise over the next six months, decreased 5.8 percentage points to 45.3%. Bullish sentiment is above its historical average of 37.5% for the 43rd time in 44 weeks.
Neutral sentiment, expectations that stock prices will stay essentially unchanged over the next six months, increased 7.9 percentage points to 29.8%. Neutral sentiment is below its historical average of 31.5% for the ninth consecutive week.
Bearish sentiment, expectations that stock prices will fall over the next six months, decreased 2.1 percentage points to 24.9%. Bearish sentiment is below its historical average of 31.0% for the fourth consecutive week.
The bull-bear spread (bullish minus bearish sentiment) decreased 3.8 percentage points to 20.4%. The bull-bear spread is above its historical average of 6.5% for the 17th time in 18 weeks.
This week’s special question asked AAII members if they are postponing any investment moves until after the November election.
Here is how they responded:
- No, I’m sticking to my long-term plan: 60.0%
- None right now, but that might change after the election results are known: 15.9%
- Yes, I’m postponing putting new money to work: 9.6%
- Yes, I switched to a more conservative allocation until after the election: 9.6%
- Other/not sure: 4.1%
Bullish: 45.3%, down 5.8 points
Neutral: 29.8%, up 7.9 points
Bearish: 24.9%, down 2.1 points
Bullish: 37.5%
Neutral: 31.5%
Bearish: 31.0%
See more Sentiment Survey results.

AAII Asset Allocation Survey
Individual investors’ allocations to cash rose while stock and bond allocations decreased in the August Asset Allocation Survey.
Stock and stock fund allocations decreased 1.3 percentage points to 68.8%. Stock and stock fund allocations are above their historical average of 61.5% for the 51st consecutive month.
Bond and bond fund allocations decreased 0.1 percentage points to 14.4%. Bond and bond fund allocations are below their historical average of 16.0% for the seventh consecutive month.
Cash allocations increased 1.4 percentage points to 16.8%. Cash allocations are below their historical average of 22.5% for the 21st consecutive month. Cash allocations’ month-to-month increase was last higher in October 2022 (2.8%).
- Stocks and Stock Funds: 68.8%, down 1.3 percentage points
- Bonds and Bond Funds: 14.4%, down 0.1 percentage points
- Cash: 16.8%, up 1.5 percentage points
- Stocks: 30.7%, down 3.1 percentage points
- Stocks Funds: 38.1%, up 1.7 percentage points
- Bonds: 4.3%, down 0.4 percentage points
- Bond Funds: 10.1%, up 0.3 percentage points
- Stocks/Stock Funds: 62.0%
- Bonds/Bond Funds: 16.0%
- Cash: 22.0%
Take the Asset Allocation Survey.
August 29, 2024 The Advantages of Combining Momentum and Equal Weighting
August 22, 2024 August Charts of Interest: A Key Indicator Now Suggests No Recession
August 15, 2024 Profit by Buying the S&P 500's Castoffs
August 8, 2024 Three Signals for When to Buy Stocks During Market Drops

Discussion
Barry J from TX posted over 2 years ago:
Charles, you always educate me. (Great minds have tried and failed at this task.) This time you urged us to be true to our “Individual Investor” heritage (echoing James Cloonan’s mantra) and take advantage of opportunities to invest outside the “major” indexes. This article says that there are 5,385 exchange listed stocks in the US and that 70% are not included in the SPX500 (large caps), SPX MidCap400 or SPX SmallCap 600 indexes. My third-grade public school education says this adds up to about 1,500. The US stock indices I currently invest in are these 5 majors: S&P 500, DJIA 30/DJTA 30, Nasdaq Composite 2,500 or so, and the Russell 2000. Those add up to about 5,000. I realize there are some overlaps here that may resolve the arithmetic. The 5 indexes I referenced above seem to cover well over 95% of ALL US stock listings (and I didn’t include the Russell 3000 which brings in another 1000 or so microcaps). Similar to your retirement portfolio, I currently use “total stock market” and "total bond market" funds to gain exposure to ALL the MAJOR indexes I named (and Ex-US markets for diversification). I hear your call to action. But what is missing here? This seems like a great marketing opportunity for AAII to explain how the 60 or so guru screens and Premium programs already enable us to take advantage of these opportunities. That’s your cue to assign Wayne or Cynthia (Superman and Lois Lane?) on this one. Up, up, and away. It's a bird. It's a plane ...
Barry J from TX posted over 2 years ago:
On a more ominous note, the second graph in this article, "More Stocks Trade Above $100 per Share" may provide a new and reinforcing early warning signal that informs us what we might expect of 2025 markets. Look at the years that FOLLOWED the years where stock prices were highest (the ones WITH the bars). Here’s what I see: The 2000 dot.com bubble followed 1999 high prices. 2004 high prices rekindled the 2000 dot.com bubble. 2009 high prices initiated the 2009-2010 Great Recession. A 39% 2018 market drawdown followed 2017 high prices. The 2020 Covid recession followed 2019 high prices. Do 2024 all-time high prices foretell a drawdown/recession for 2025? We will have to wait for NBER, who is assigned to make the "official" call on whether we are "officially" in a recession based on two consecutive quarters of decreasing GDP. That won't happen until they get data for 3Q24 and 4Q24 which will not be available until early 2025, probably after the winner of the election is in office (on Jan 20 2025) and beyond the “first 100 days” (ending about April 30th). We already have Sahm Rule data showing that the 3-month average US unemployment rate is now > 0.5% from its prior 12-month low. This says the US is already in a recession. In the 11 recessions since 1950, the Sahm Rule has triggered a recession during EVERY TIME, on an average about 3 months INTO the recession -- well before GDP data make it clear and long before the NBER officially declares the US is in a recession. Since 1950, the Sahm rule has indicated only 1 false positive (1959) an even then, 6 months later US entered a recession. I think we are already in a recession. Do we have to wait for a late call by the referee?
You need to log in as a registered AAII user before commenting.
Create an account