

Profit by Buying the S&P 500's Castoffs
by Charles Rotblut | August 15, 2024
There has been upside to buying stocks booted out of the large-cap indexes. Investment advisory firm Research Affiliates LLC found that stocks dumped by the S&P 500 index have gone on to outperform the large-cap index by more than 5% per year. The firm’s analysis covered the period of 1990 to 2022. (Stocks nixed from the indexes because of mergers or acquisitions were excluded from the analysis.)
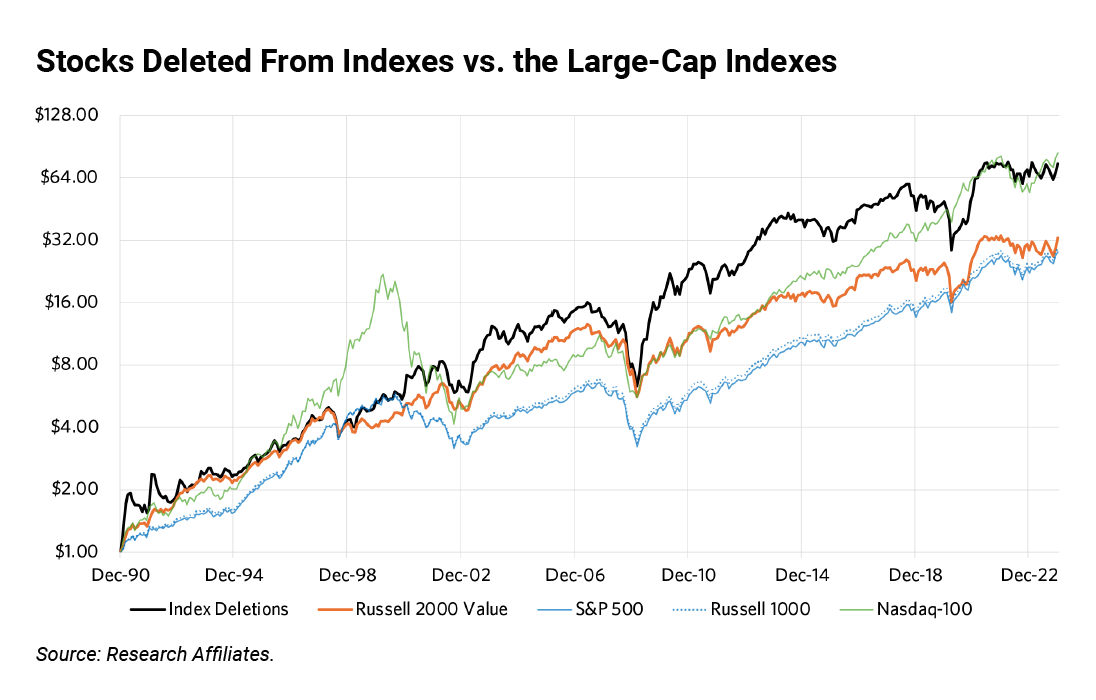 Valuations and liquidity are the reason. Prior to being cast off from the S&P 500, the Nasdaq-100 index or the Russell 1000 index, such stocks underperform. They tend to further underperform as portfolio managers tracking the respective index sell their shares. This downward pressure results in low relative valuations.
This valuation gap starts closing after post-deletion selling has subsided. Then these stocks begin to feel love from investors again and go on to outperform.
Sounds simple, doesn’t it? Identify the stocks that have been removed from the S&P 500, Nasdaq-100 or Russell 1000—information that is accessible through press releases—buy them and hold them for five years. Well, there are caveats to consider.
The study’s coauthors Rob Arnott and Forrest Henslee acknowledged that deletions haven’t beaten the S&P 500, Nasdaq-100 or Russell 1000 over the last decade. “The current growth-dominated bull market has left value and small-cap stocks in the dust.”
Buying and holding deletions is a value strategy with a significant small-cap tilt. It involves buying stocks that are now undervalued because they were booted out of large-cap indexes. When value and size underperform, so does the deletions strategy. (Size plays a role because stocks that are nixed from the Russell 1000 are too small for the S&P 500 or the Nasdaq-100.)
The deletions strategy has beaten the Russell 2000 Value index over the past 33 years. “When deletions outpace the Russell 2000 Value, they win by more than 18%, on average … When deletions underperform, they lag by 5.3% on average, with a shortfall of over 10% only twice,” observed Arnott and Henslee.
Those seeking to incorporate this strategy should note that a quality requirement is included in the newly launched Research Affiliates Deletions index (NIXT). It considers debt metrics, a company’s total payout ratio (five years of retained earnings to five years of gross profits) and net payout ratio (dividends and buybacks relative to total assets). Companies ranking in the bottom 20% are excluded. This was not mentioned in the deletions paper. A+ Investor, VMQ Stocks and Platinum subscribers could use the A+ Quality Grade as a substitute to weed out the stocks with the weakest quality.
No exchange-traded fund (ETF) currently exists to track this strategy. The index rules call for an equal weighting, with the portfolio rebalanced once per year. Stocks are held for a maximum of five years.
It makes sense that the booted companies would become undervalued and bounce back. It also makes sense to overlay a quality filter because some companies are booted from the indexes because they are no longer good companies. But, as stated above, this is a value strategy. It is likely to do well when value stocks—particularly small-cap value stocks—do well and lag when they don’t.

-
Reaction to Being Added to or Removed From the S&P 500 Is Lessening
The index effect has been weakening over time, according to an analysis by S&P Dow Jones Indices. -
AAII’s Quality Grade Undergoes Expansion: Looking Behind the Curtain
Based on research into various components that reflect a company’s “quality,” we tweaked the quality grade for stocks. -
How to Boost Returns by Incorporating Momentum
Portfolios of companies with strong price momentum have realized higher returns than the portfolios of companies with weak momentum. -
The Role of Financial Stability in Achieving Life Well-Being
In the August 2024 AAII Journal, Meir Statman explains why the financial domain has a special place among the domains of life well-being.
AAII Sentiment Survey
Bearish sentiment among individual investors about the short-term outlook for stocks decreased in the latest AAII Sentiment Survey. Meanwhile, both optimism and neutral sentiment increased.
Bullish sentiment, expectations that stock prices will rise over the next six months, increased 2.0 percentage points to 42.5%. Bullish sentiment is above its historical average of 37.5% for the 40th time in 41 weeks.
Neutral sentiment, expectations that stock prices will stay essentially unchanged over the next six months, increased 6.6 percentage points to 28.6%. Neutral sentiment is below its historical average of 31.5% for the sixth consecutive week.
Bearish sentiment, expectations that stock prices will fall over the next six months, decreased 8.6 percentage points to 28.9%. Bearish sentiment is below its historical average of 31.0% for the eighth time in 10 weeks.
The bull-bear spread (bullish minus bearish sentiment) increased 10.6 percentage points to 13.7%. The bull-bear spread is above its historical average of 6.5% for the 14th time in 15 weeks.
This week’s special question asked AAII members how they would describe the current state of the economy.
Here is how they responded:
- Great: 1.8%
- Good: 34.1%
- Mixed: 47.8%
- Lousy: 15.6%
- Not sure/no opinion: 0.4%
Bullish: 42.5%, up 2.0 points
Neutral: 28.6%, up 6.6 points
Bearish: 28.9%, down 8.6 points
Bullish: 37.5%
Neutral: 31.5%
Bearish: 31.0%
See more Sentiment Survey results.

August 8, 2024 Three Signals for When to Buy Stocks During Market Drops
August 1, 2024 Avoid These Costly Retirement Account Rollover Mistakes
July 25, 2024 July Charts of Interest: The Small-Cap Stock Resurgence
July 18, 2024 Chasing Super High Yields Can Burn Your Portfolio

Discussion
John L from NJ posted over 2 years ago:
The past is prologue but which past? As a strategy to out perform (index castoffs) becomes widely known it's out performance declines. It is almost like the market is efficient or something.
Barry J from TX posted over 2 years ago:
Charles, this was a very entertaining article. However, due to my personal goals, risk tolerances, and acquired habit to avoid investments I do not understand how the “Index Deletions Investing Over Time Strategy” – “IDIOTS” strategy, for short -- benefits me. IDIOTs seem about as useful to me as the copy of last week’s WSJ Financial Section front page lining my Yorkie’s poop pad. What you did, sir, and I greatly appreciate this – is educate me on how the major indexes that are used as benchmarks by several hundred ETFs have to cull their holdings as these deletions occur and that these actions increase the benchmarking ETF fund managers’ costs to “replicate” the benchmark’s holdings and these actions invisibly reduce my ETF returns. ETF costs are things this idiot understands.
You need to log in as a registered AAII user before commenting.
Create an account