

August Charts of Interest: A Key Indicator Now Suggests No Recession
by Charles Rotblut | August 22, 2024
I’m starting this month’s charts of interest with a well-followed economic indicator. It does not provide certainty about what will happen in the economy, but it does provide optimism that a recession will not occur in the short term.
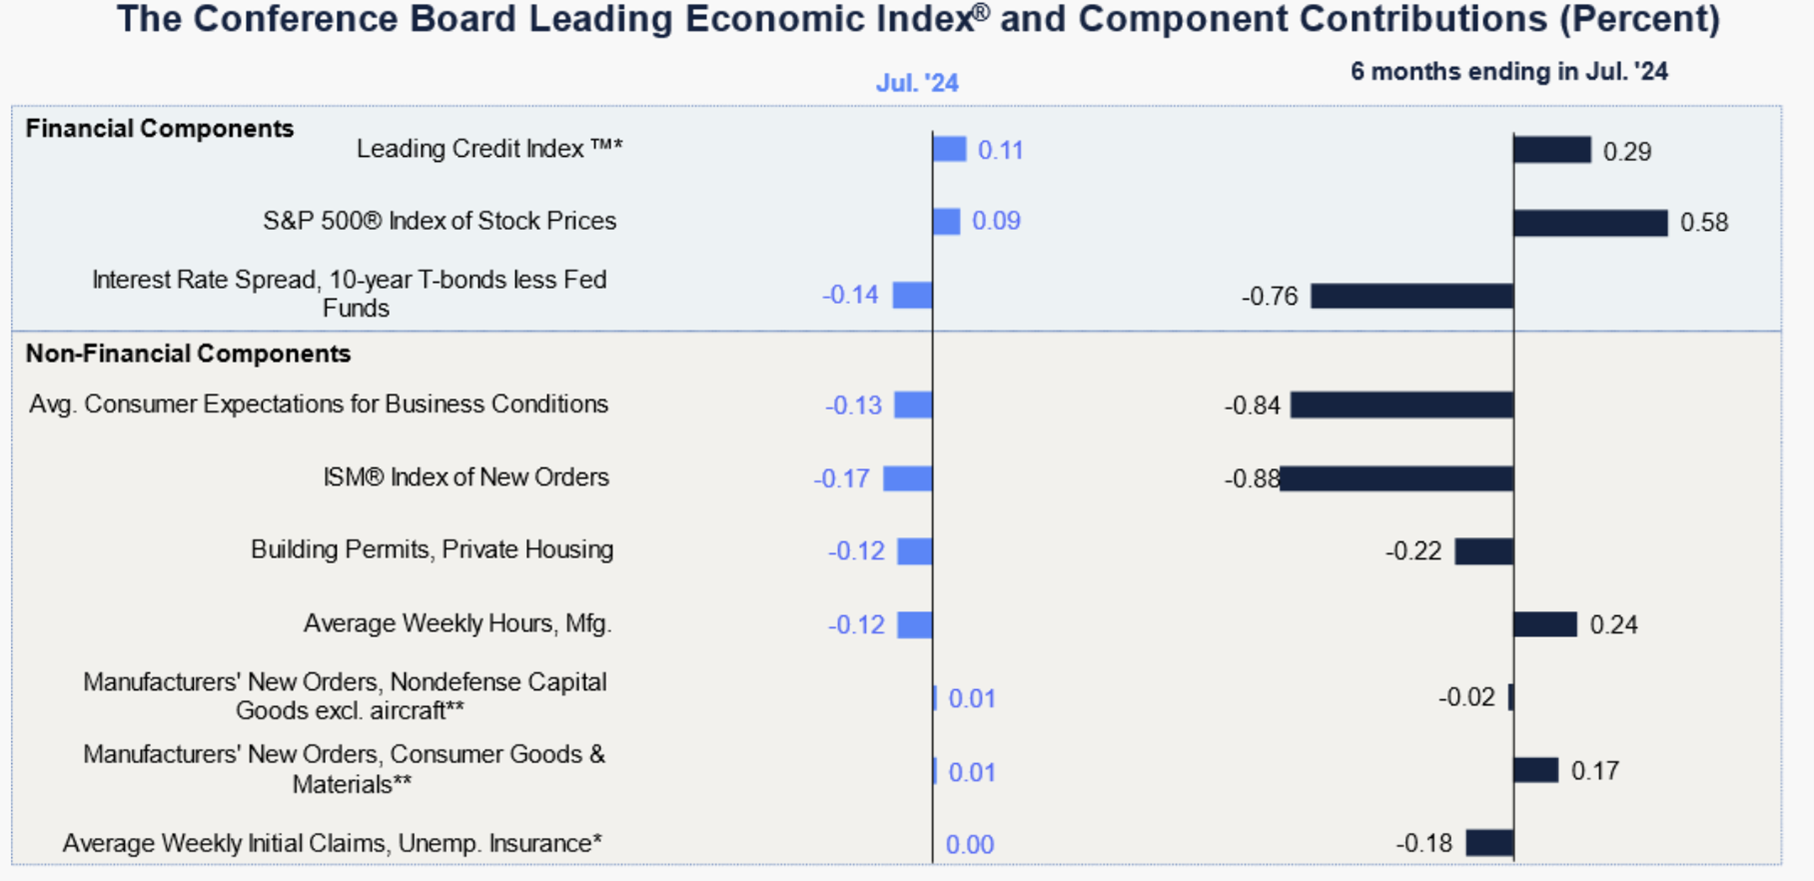
The Conference Board Inc.’s Leading Economic Index (LEI) signals growth, albeit slower growth. In the organization’s press release, senior manager of business cycle indicators Justyna Zabinska-La Monica stated, “the six-month annual growth rate no longer signals recession ahead.”

What goes into the LEI? Here’s a breakdown of the components and their recent changes.
Down Goes Volatility
My, things change quickly.
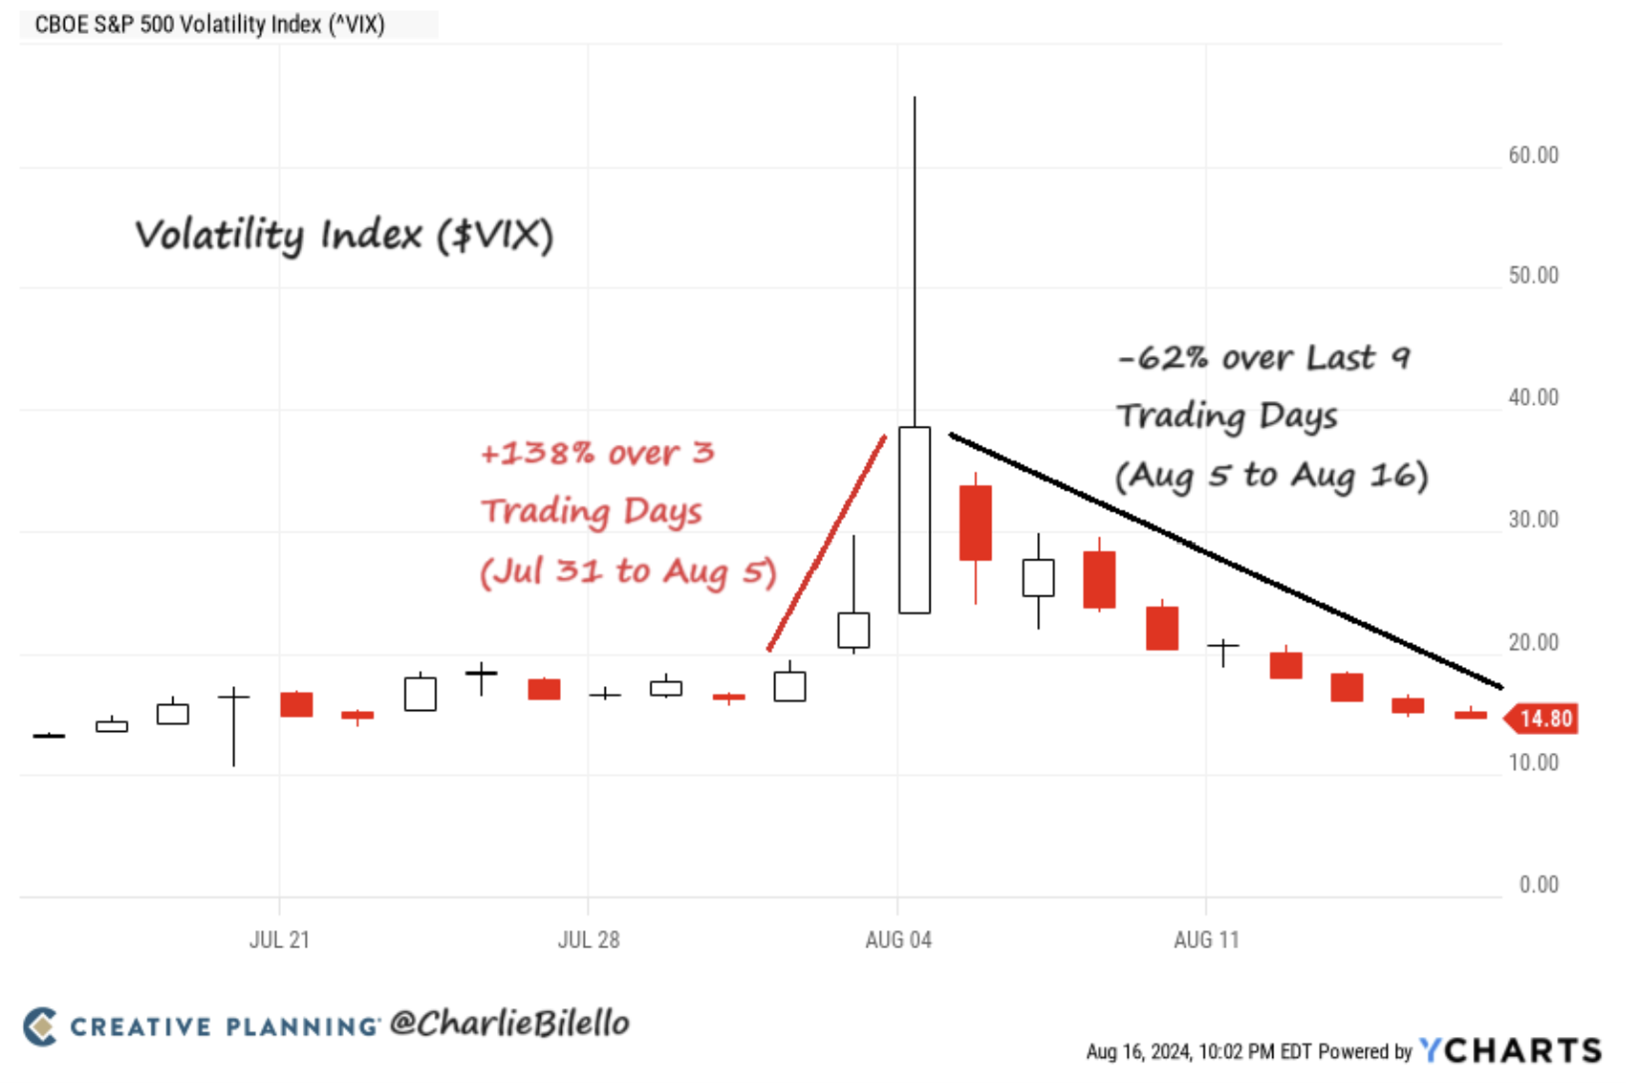
We started August with the Chicago Board Options Exchange’s (CBOE) Volatility index (VIX) closing two standard deviations above its long-term average. Such readings rank in the top 2.5% of all readings, as you may recall me saying two weeks ago.
Fast forward to the end of last week and the VIX has dropped faster than a roller coaster crossing the peak of its first ascent. According to Charlie Bilello, over the last nine trading days, “we’ve experienced the biggest volatility crash in history,” with the VIX declining 62%, from 38.57 to 14.80 on a closing basis.
The drop in volatility has coincided with the rise in stock prices.
Credit Spreads Remain Tight
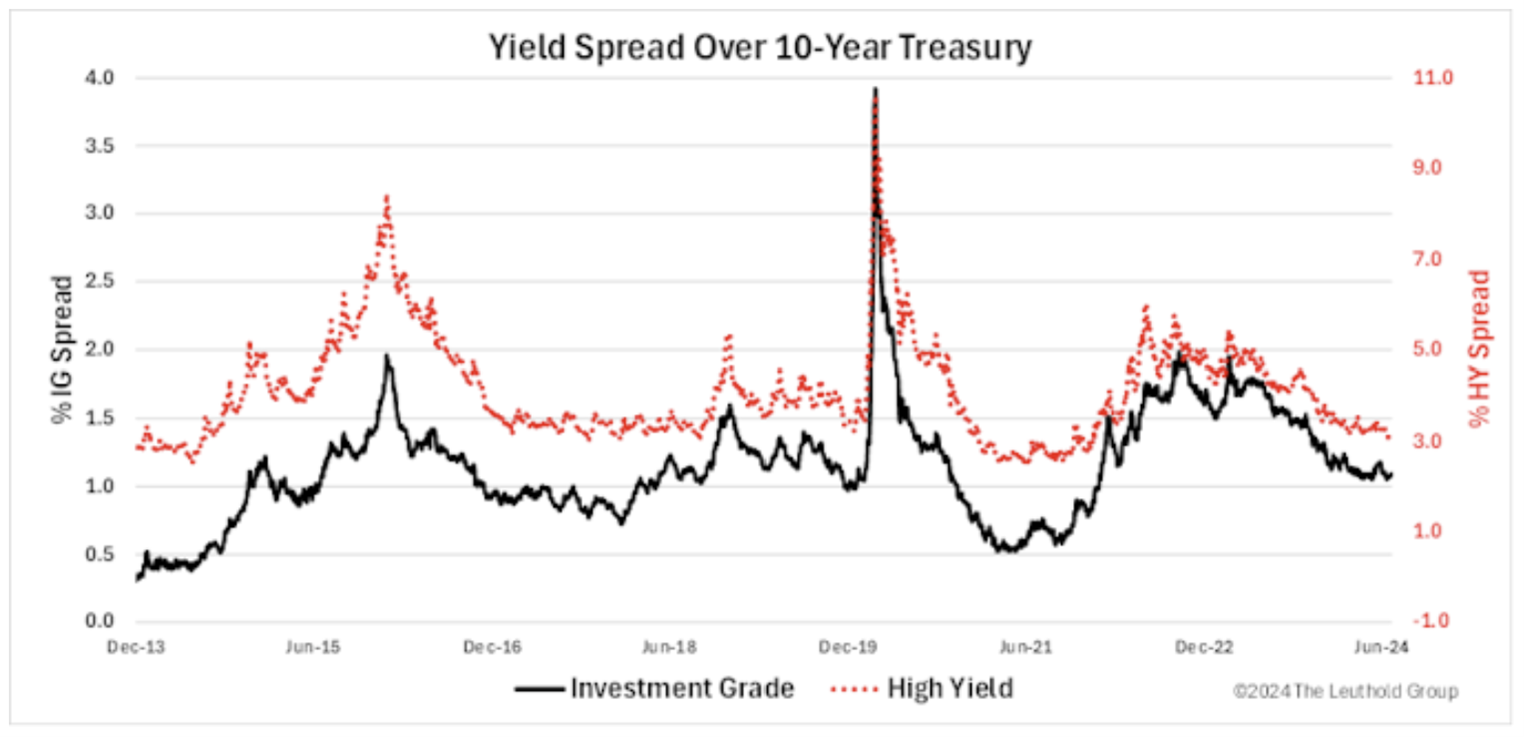
Credit spreads are the difference in yields offered by investment-grade bonds and high-yield bonds. “ICE BofA credit spreads for investment-grade debt (solid line) and high-yield corporate bonds (dotted line) have tightened in recent months, touching levels near the low-stress environment that preceded the 2020 pandemic,” observes Scott Opsal, CFA, of the Leuthold Group. The closer the two yields are, the less investors receive in compensation for taking on extra credit risk.
Gold Is Glittering
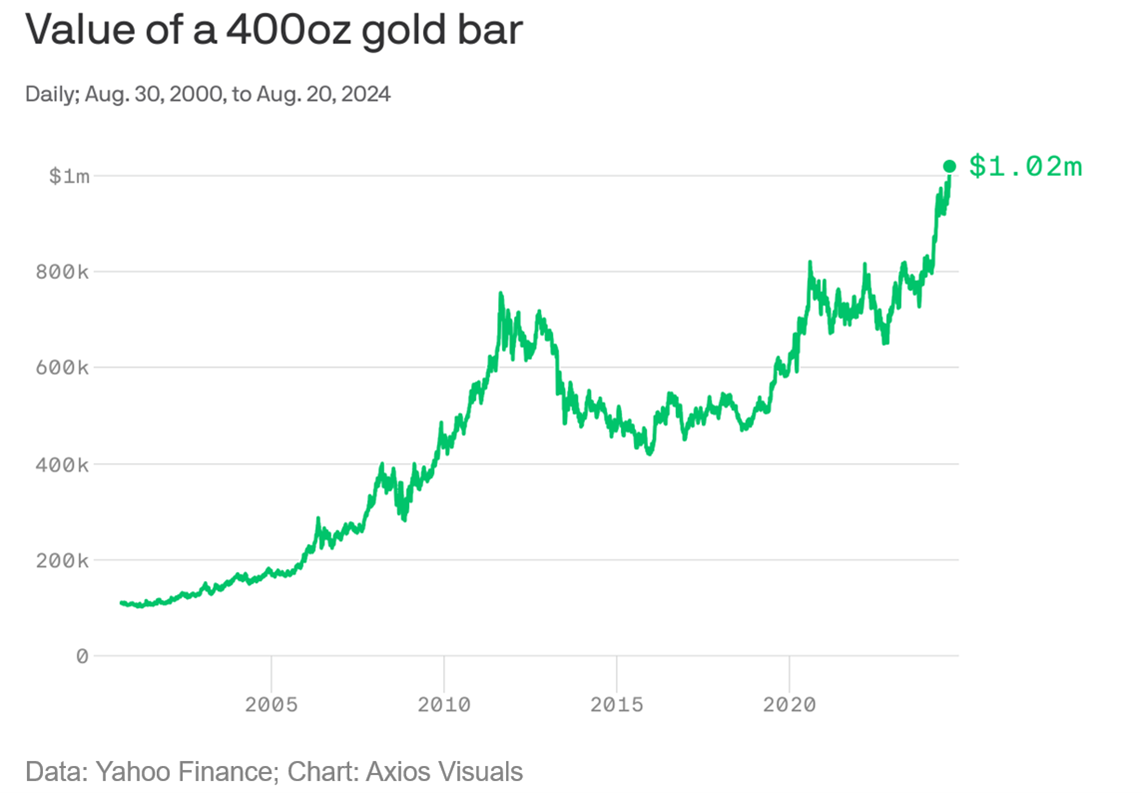
Gold set a new record high this week, as the chart from StockCharts shows.
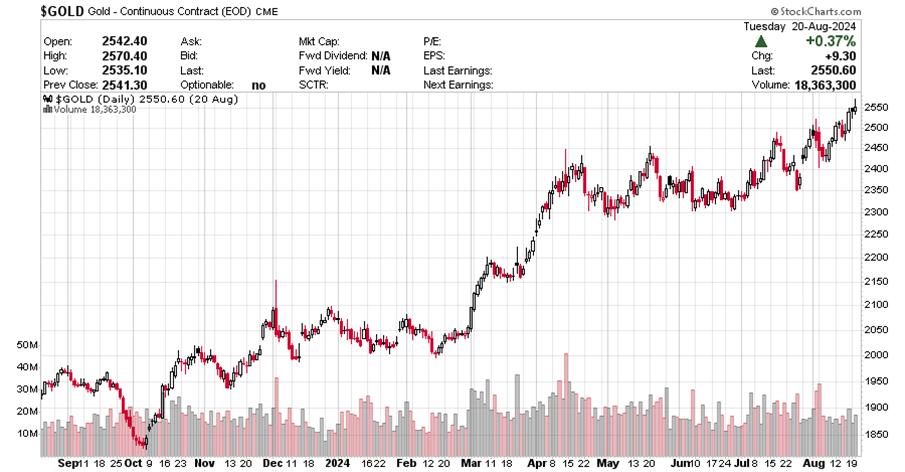
The rise in gold prices has pushed the cost of a gold bar above $1 million for the first time. Gold bars are also sold out at Costco, or at least no longer available on its website.
More Homes Are Now Worth Seven Figures
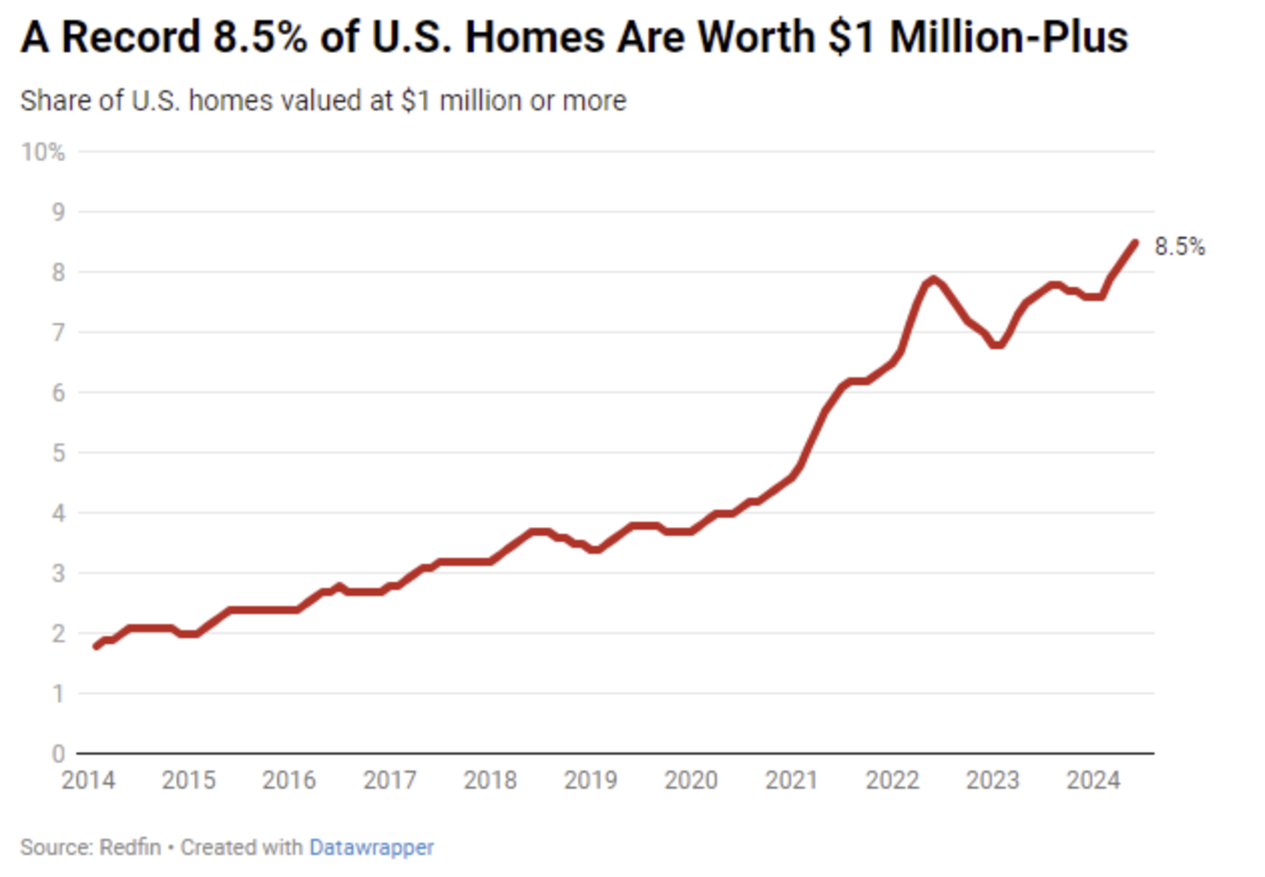
“Nearly one in 10 (8.5%) U.S. homes are worth $1 million or more, the highest share of all time,” reports Redfin. That’s up from 7.6% one year ago and more than double the 4.0% share before the coronavirus pandemic.
If anybody wants to offer $1 million for my townhome, I can move out within a few days.

-
What You Can Gain From Reading the Economic Tea Leaves
Comparing changes in given metrics and their relative performance allows us to assess if economic activity is accelerating or decelerating and adjust our portfolio allocations if desired. -
Investing in Gold
There are several choices for investors who want to add an allocation to gold to their portfolios. What you need to know about the various options. -
Maximizing Retirement Income With Asset Location
The August 2024 AAII Journal offers smart asset location tips that can reduce your tax exposure in retirement.
AAII Sentiment Survey
Bullish sentiment among individual investors about the short-term outlook for stocks increased in the latest AAII Sentiment Survey. Meanwhile, neutral sentiment and pessimism decreased.
Bullish sentiment, expectations that stock prices will rise over the next six months, increased 9.1 percentage points to 51.6%. Bullish sentiment is now unusually high and is above its historical average of 37.5% for the 41st time in 42 weeks. Bullish sentiment was last higher on July 18, 2024 (52.7%).
Neutral sentiment, expectations that stock prices will stay essentially unchanged over the next six months, decreased 3.8 percentage points to 24.7%. Neutral sentiment is below its historical average of 31.5% for the seventh consecutive week.
Bearish sentiment, expectations that stock prices will fall over the next six months, decreased 5.2 percentage points to 23.7%. Bearish sentiment is below its historical average of 31.0% for the ninth time in 11 weeks.
The bull-bear spread (bullish minus bearish sentiment) increased 14.3 percentage points to 28.0%. The bull-bear spread is above its historical average of 6.5% for the 15th time in 16 weeks.
This week’s special question asked AAII members about their perception of second-quarter 2024 earnings.
Here is how they responded:
- They approximately matched my expectations: 45.2%
- They were better than I expected: 33.8%
- They were worse than I expected: 5.5%
- No opinion: 15.2%
Bullish: 51.6%, up 9.1 points
Neutral: 24.7%, down 3.8 points
Bearish: 23.7%, down 5.2 points
Bullish: 37.5%
Neutral: 31.5%
Bearish: 31.0%
See more Sentiment Survey results.

August 15, 2024 Profit by Buying the S&P 500's Castoffs
August 8, 2024 Three Signals for When to Buy Stocks During Market Drops
August 1, 2024 Avoid These Costly Retirement Account Rollover Mistakes
July 25, 2024 July Charts of Interest: The Small-Cap Stock Resurgence

Discussion
steve kalish from Maryland posted over 2 years ago:
AAII is the best investments education org. These metrics are often discussed as predictive. Has there been any formal back testing to determine if any of them are ever accurate?
Barry J from TX posted over 2 years ago:
Charles, this month's Charts of Interest is a font of investment ideas. The question is which is the BEST investment tip in this article? #1) Investing $1M in equities that that the TCB LEI-predicted recession will not occur in the short term (next 6 months?) #2) Betting $1M on the credit spread yields between investment-grade bonds and high-yield bonds? #3) Betting $1M that stock will rise after the CBOE VIX crash? #4) Buying $1M of gold bars on an Amex at Costco? # 5) Buying Charles' house in Chicago for $1M?
Charles M Rotblut from Illinois posted over 2 years ago:
Barry - Clearly, buying my house for $1 million is the best investment :)
Steve - The LEI is useful for painting a broader mosaic of the economy. I don't think there is a single indicator that works by itself. Even the inverted yield curve has so far not been predictive in the current economic environment because of what happened during and after the pandemic.
-Charles
You need to log in as a registered AAII user before commenting.
Create an account