

The Advantages of Combining Momentum and Equal Weighting
by Charles Rotblut | August 29, 2024
Featured Tickers: EQAL
RSP
SPMO
EQAL
RSP
SPMO
Value has long been known as a counter to growth in the investing world. The folks at S&P Dow Jones Indices have recently pointed out another odd couple: equal weight and momentum.
Equal-weight strategies assign the same portfolio weighting to all stocks. The S&P 500 Equal Weight index rebalances quarterly to a 0.2% position for each of its 500 stocks.
Momentum strategies hold outperforming stocks and avoid underperforming stocks. The S&P 500 Momentum index holds the 100 stocks in the S&P 500 index with the highest 12-month relative strength. These are the stocks that have realized the highest returns relative to the S&P 500.
Momentum strategies shed the stocks with the worst relative strength and replace them with the current top-performing stocks at each rebalancing interval. Equal-weight strategies pare their largest positions (which are also the best-performing stocks) at each rebalancing interval and buy additional shares of the worst-performing stocks.
Put another way, momentum strategies rebalance into winners. Equal-weight strategies rebalance into losers. This difference causes one strategy to zig when the other zags. It makes the two strategies good portfolio partners for those seeking to diversify by style.
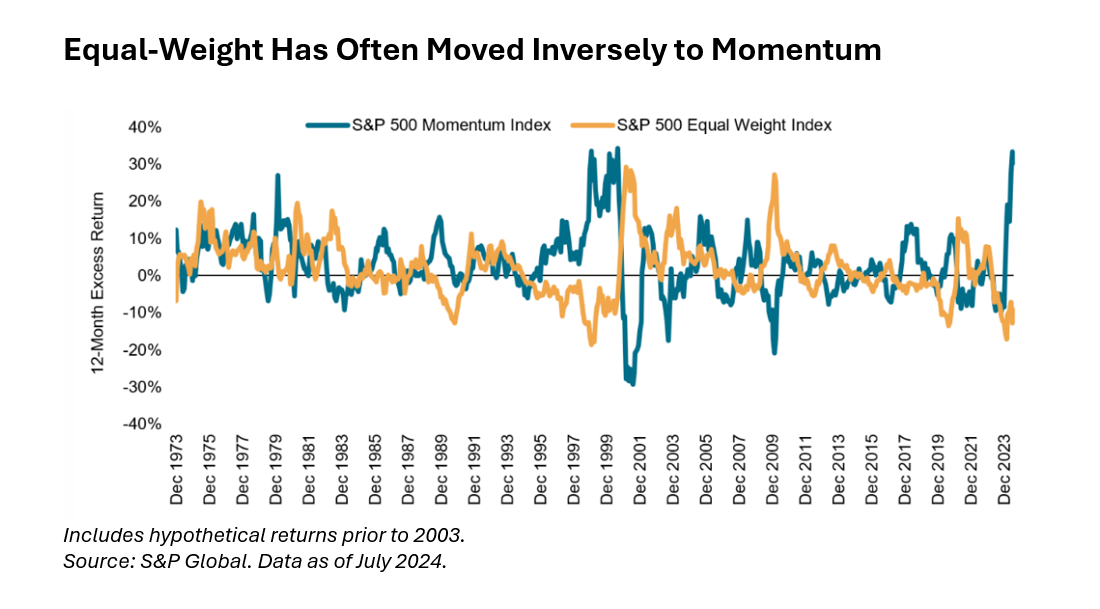
Equal-weight strategies expose investors to the size factor. By design, smaller companies have as much influence on returns as larger companies do. According to S&P Dow Jones Indices, the S&P 500 Equal Weight “has close to 80% of its weight in the smallest 400 companies of the S&P 500,” compared to only 27% for the market-capitalization-weighted benchmark.
Going back to our comparison, the median market cap of the S&P 500 Equal Weight was $36.3 billion at the end of July. The median market cap was $72.1 billion for the S&P 500 Momentum.
A big part of the difference relates to the current concentration of the overall S&P 500. The 10 largest stocks in the S&P 500 had a combined 34.4% weighting at the end of July. Because most of these stocks are also the S&P 500’s best performers, they have an outsized allocation in the S&P 500 Momentum. The combined weight of the 10 largest stocks in the S&P 500 Momentum was 64.7% at the end of July.
The combined weight of the 10 largest stocks in the S&P 500 Equal Weight was just 2.5% as of July 31.
There is nothing stopping momentum strategies from equal weighting their portfolios. If they were drawing from the same universe, there could still be an anti-size effect from equal weighting. The selected stocks for the momentum strategy would be the ones incurring largest relative gains in market cap.
If you were to hold the Invesco S&P 500 Equal Weight ETF  (RSP) and the Invesco S&P 500 Momentum ETF (SPMO) in the same portfolio, you’d want to establish some type of rebalancing strategy between the two. It could be time-based (e.g., annually) or threshold-based—e.g., when one exchange-traded fund’s (ETF) allocation becomes 10% larger than the other’s. You could also combine other momentum-focused ETFs with the Invesco Russell 1000 Equal Weight ETF (EQAL) to draw from a larger universe of stocks.
An alternative is to combine momentum and/or equal-weight ETFs with a traditional market-cap-weighted index. Doing so would give you a smaller tilt away from the market portfolio, making the impact less influential.
I personally own the Invesco Russell 1000 Equal Weight in my Roth individual retirement accounts (IRAs) as well as in my taxable brokerage account. (I also have a very small position in the Invesco S&P 500 Equal Weight related to previous tax-loss harvesting.) I am market-cap agnostic when it comes to investing in individual stocks, and the Invesco Russell 1000 Equal Weight better reflects my approach. Plus, equal-weight strategies have outperformed the market-cap-weighted indexes over the long term.

-
Tempering the Risks of Market-Cap Weighting
Genuine diversification across the various segments of the U.S. equity market is a prudent investment philosophy. -
Incorporating Equal-Weighted Funds Into Your Allocation
Equal-weighted funds hold the same securities as similar market-cap-weighted funds but in different proportions, reducing stock-specific risk. -
Gabelli’s Insights on Value Investing Today
The August 2024 AAII Journal features tips from an expert stock-picker on how to stay current with your investing strategies as the market evolves.
AAII Sentiment Survey
Pessimism among individual investors about the short-term outlook for stocks increased in the latest AAII Sentiment Survey. Meanwhile, both optimism and neutral sentiment decreased.
Bullish sentiment, expectations that stock prices will rise over the next six months, decreased 0.5 percentage points to 51.2%. Bullish sentiment is unusually high for the second consecutive week and is above its historical average of 37.5% for the 42nd time in 43 weeks.
Neutral sentiment, expectations that stock prices will stay essentially unchanged over the next six months, decreased 2.9 percentage points to 21.9%. Neutral sentiment is below its historical average of 31.5% for the eighth consecutive week.
Bearish sentiment, expectations that stock prices will fall over the next six months, increased 3.3 percentage points to 27.0%. Bearish sentiment is below its historical average of 31.0% for the third consecutive week.
The bull-bear spread (bullish minus bearish sentiment) decreased 3.8 percentage points to 24.2%. The bull-bear spread is above its historical average of 6.5% for the 16th time in 17 weeks.
This week’s special question asked AAII members if they believe gold’s recent record high prices are sustainable over the next year.
Here is how they responded:
- Yes, gold prices will increase further: 27.0%
- Yes, gold prices will stabilize at current levels: 16.2%
- No, gold prices will decrease moderately: 29.7%
- No, gold prices will significantly drop: 3.2%
- Don’t follow gold prices/no opinion: 23.8%
Bullish: 51.2%, down 0.5 points
Neutral: 21.9%, down 2.9 points
Bearish: 27.0%, up 3.3 points
Bullish: 37.5%
Neutral: 31.5%
Bearish: 31.0%
See more Sentiment Survey results.

August 22, 2024 August Charts of Interest: A Key Indicator Now Suggests No Recession
August 15, 2024 Profit by Buying the S&P 500's Castoffs
August 8, 2024 Three Signals for When to Buy Stocks During Market Drops
August 1, 2024 Avoid These Costly Retirement Account Rollover Mistakes

Discussion
John L from NJ posted over 2 years ago:
Momentum is kind of like heat chasing. And we know how that ends. Equal weighting sells the successful stocks of growing companies at each re-balancing. Before even considering combining these two strategies, I would like to see a back test versus a simple buy and hold of the S&P 500 over the last 10 years. Without any back testing this entire article is just word salad.
Jay D from Delaware posted over 2 years ago:
Agree with John L: Word Salad. Surely some PhD candidate has back tested this combining theory.
Charles Rotblut from Illinois posted over 2 years ago:
John and Jay, S&P Dow Jones Indices publishes a monthly dashboard for their factor indexes. This dashboard includes rolling 15-year returns. Through the end of July, the S&P 500 Momentum index has an annualized return of 15.8%. The S&P 500 Equal Weight index has an annualized return of 13.7%. The S&P 500's annualized return is 14.4%.
-Charles
Barry J from TX posted over 2 years ago:
I always learn something for Charles’ monthly gedankenexperiments. We could wait for back testing to get a “more perfect” answer, but the figure in the article provides 26 visual data points over the last 60 years (1973-2023) at two-year EOY intervals for the normal variable SPX MC (MO) to the alternative variable, SPX EW. As Femi taught us, you always have more sources of information at hand than you think, and he advocated that you practice your skills. The tacit question Charles poses may be approximated by “eye-balling” the data in the figure. Applying Fermi’s estimation process to the visual data in the figure, it appears that the frequency of crossovers and the mean time between crossovers have both increased significantly since the 2008-2009 GR and maybe the 200 dot.com bubble. Increasing computing power and faster access to data (the internet revolution) may have driven this trend. Memory of our recent experiences with the SPX and Charles’ MC vs EW comparisons using the two Invesco EFTs support the observation that SPX EW is becoming increasingly more volatile. A second observation is that both MC/MO and EW are experiencing shorter-term dominance effects. Thus, if one wants to benefit from Charles’ article using either a MC or an EW strategy, it will require a higher degree of agility in gathering, tracking, and acting on the data we need to benefit from any market timing to achieve a greatest benefit. And the EMH says IIs will be the last group to have the data to act on any changes, except the ardent technical analysts and even they have to face well-armed market competition of the several millions market professionals that have more and faster computing power. Some combination of The ETF strategies Charles outlined seem to provide a more effective strategy. The Top 10 MC stocks dominate the Top 10 EW stocks by a factor of 26. So “downside “cost” of a balanced MC/EW strategy may be “missing out” on the potential benefits of riding the tech AI wave until it arrives at similar fates as all prior technical evolutions.
You need to log in as a registered AAII user before commenting.
Create an account