

September Charts of Interest: Rate Cut Edition
by Charles Rotblut | September 19, 2024
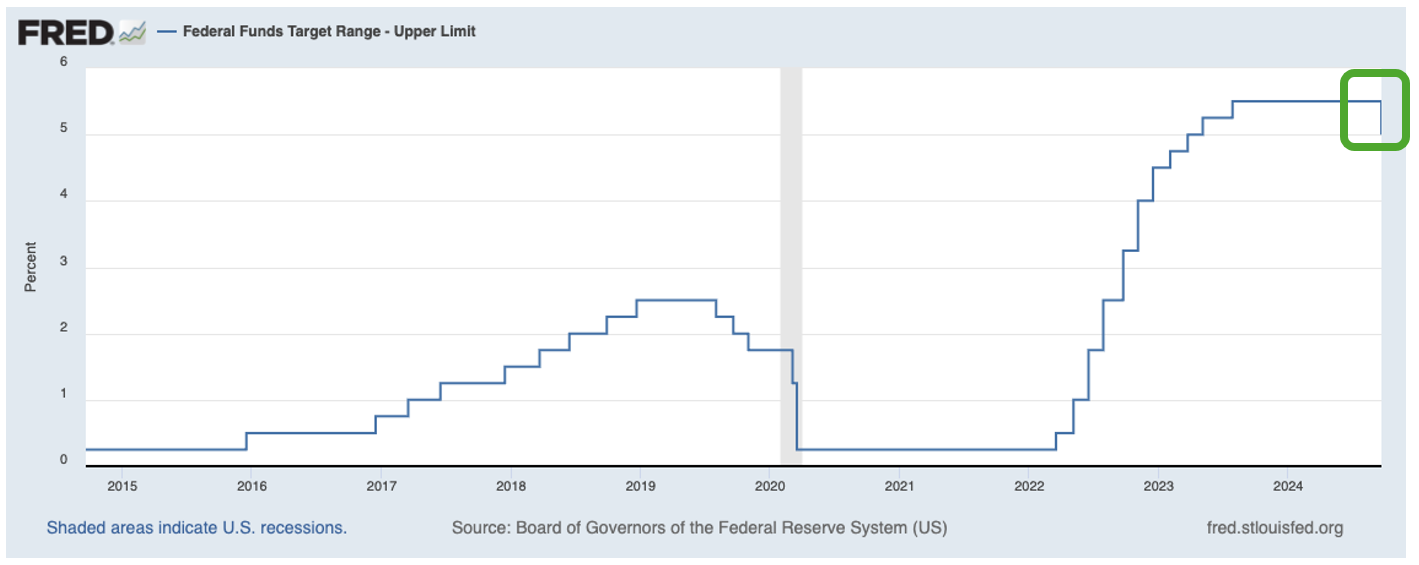
Yesterday’s 50-basis-point interest rate cut by the Federal Open Market Committee (FOMC) was the first cut since March 2020. So, I start this month’s charts of interest by showing you how the FOMC’s target rate has changed over time. This chart is from the St. Louis Federal Reserve’s FRED database.
FOMC members anticipate making more interest rate cuts this year, as their “dot plot” below shows. The median projection calls for the target rate to end 2024 at 4.4%. Three months ago, the median projection of committee members was 5.1%. (For 2025, the median end-of-year projection is now 3.4%, down from 4.1%.)
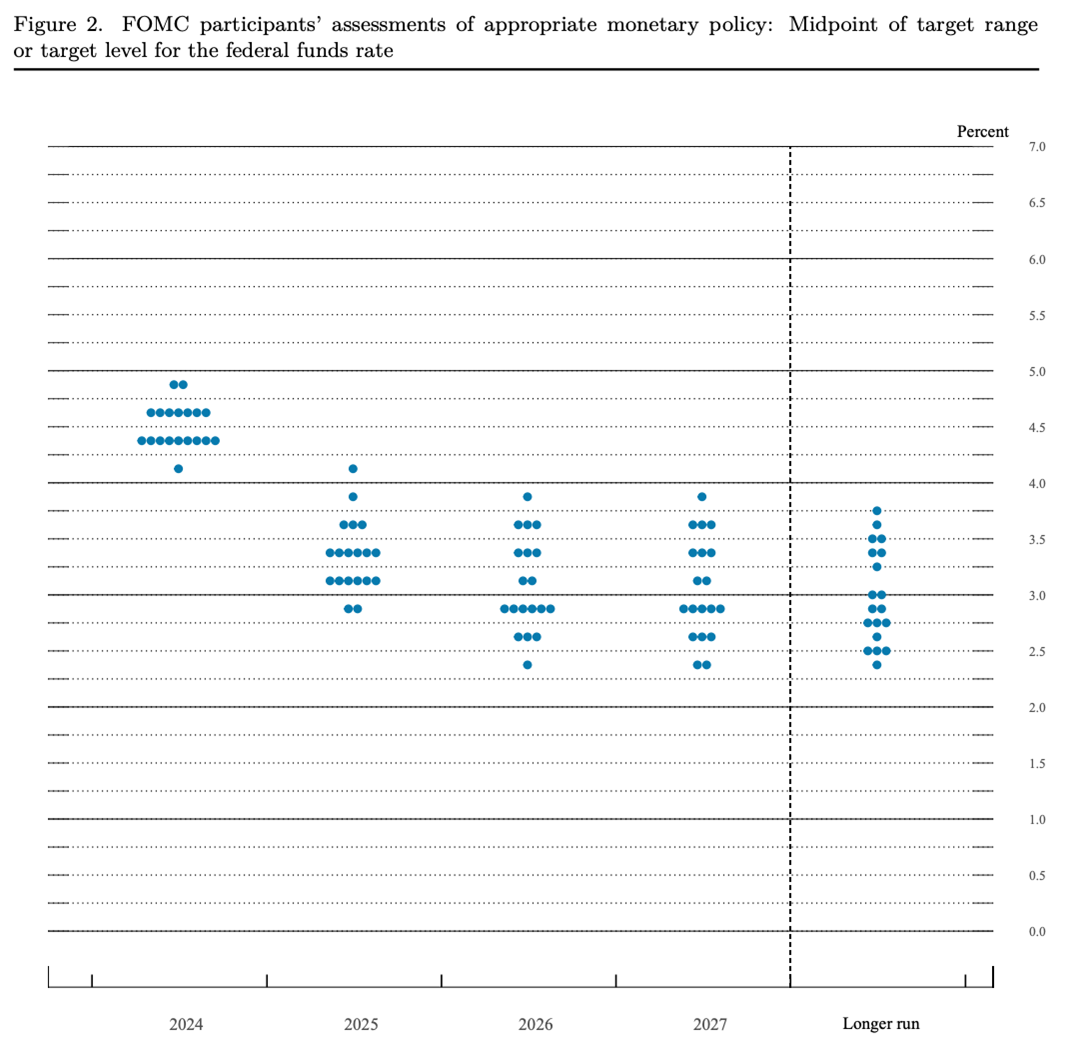
Source: “Summary of Economic Projections,” by the Board of Governors of the Federal Reserve System, September 18, 2024.
The Mortgage Market Has Started to Adjust
“While mortgage rates do not directly follow moves by the Federal Reserve, this first cut in over four years will have an impact on the housing market,” stated Freddie Mac this morning. “Declining mortgage rates over the last several weeks indicate this cut was mostly baked in, but rates will likely fall further, sparking more housing activity.”

All-Time Highs and Interest Rate Cuts Have Been Good Partners
The $64,000 question is: Where do stocks go from here? Since I am generally an optimist, I’ll start with the good news.
The S&P 500 index has gone on to realize positive 12-month returns when an interest rate cut coincided with the S&P 500 trading near an all-time high. Carson Group chief market strategist Ryan Detrick, CMT, says this has happened 20 consecutive times.

But … the Ride Could Be Bumpy
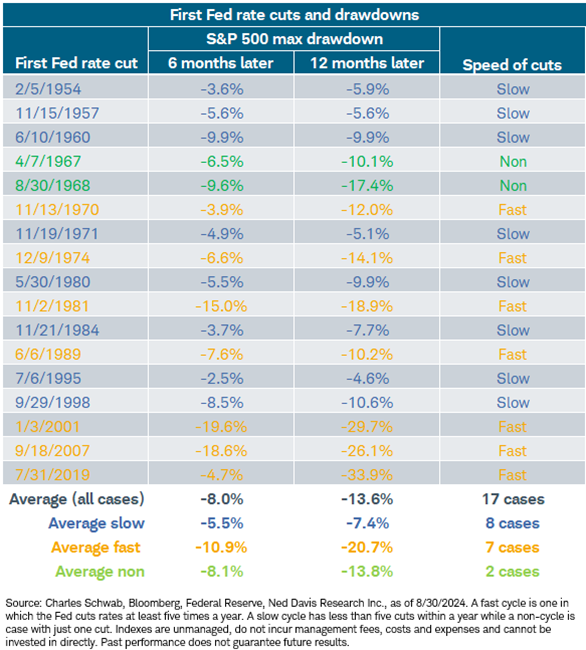
The S&P 500 has experienced an average maximum drawdown of 20.7% within one year of the Fed starting “a fast-cutting cycle,” observed Charles Schwab senior investment strategist Kevin Gordon. The average maximum drawdown for a slow-cutting cycle is 7.4%.
There have typically been economic problems and/or a shock leading the Fed to cut interest rates. Such issues help to explain the prior downturns in the S&P 500. We are not facing either right now, though there are signs of the economy cooling off.
Fewer Companies Are Talking About Inflation
FactSet counted 235 S&P 500 companies as having mentioned “inflation” on their second-quarter 2024 earnings conference calls. This was the second-lowest number since the second quarter of 2021 (216 companies). Unsurprisingly, the drop coincided with a decrease in the consumer price index (CPI). The blue line and left-hand axis are the number of S&P 500 companies. The green line and the right axis are the CPI.

Dividends + Long-Term Investing = Lots of Income
Here’s a chart I shared last week in AAII Dividend Investing. The folks at Lord, Abbett & Co. LLC plotted the income generated over time by an initial investment of $10,000 each in the S&P 500 and the Bloomberg U.S. Aggregate Bond index. Thanks to earnings growth, the income from dividends far exceeded the income from bonds.

Source: Lord, Abbett & Co. LLC.
There are two notes I will add to this. First, the higher income from dividends only occurs if you have the ability and discipline to stay with stocks. Second, bonds can play a useful role in a portfolio depending on your tolerance for risk and need for more certain income.
Less Pain at the Pump
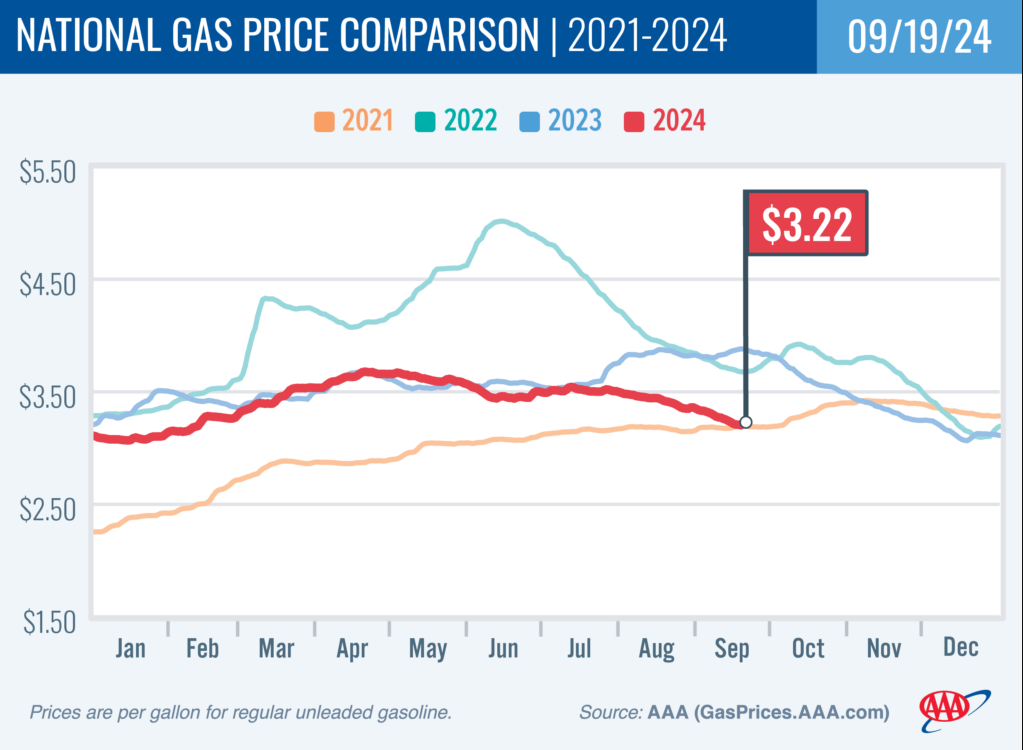
One area where we are seeing deflation is at the pump. One gallon of unleaded gasoline now costs an average of just $3.22 nationally. This is $0.66 lower than one year ago. “Gasoline demand and oil costs are low, so pump prices may soon resume a slow descent,” notes the American Automobile Association (AAA) spokesperson Andrew Gross. According to AAA, there are 14 states with average gas prices below $3.00 per gallon, “and several more may soon follow.”

-
Bond Strategies for a Shifting Interest Rate Environment
Bonds can help you achieve your financial goals by providing reliable cash flow, protecting your principal and creating growth through compounding interest. -
How to Read Dividend Red Flags
Dangerous dividends are ones that attract income-seeking investors with high but unsustainable returns. Warning signs to watch out for. -
Money in, Money out: What the Cash Flow Statement Reveals
Read the September 2024 AAII Journal to find out how the cash flow statement tells you whether a company is realizing cash (copacetic) or burning through it (unsustainable).
AAII Sentiment Survey
Bullish sentiment among individual investors about the short-term outlook for stocks increased in the latest AAII Sentiment Survey. Meanwhile, neutral sentiment and pessimism decreased.
Bullish sentiment, expectations that stock prices will rise over the next six months, increased 11.0 percentage points to 50.8%. Bullish sentiment is unusually high and is above its historical average of 37.5% for the 45th time in 46 weeks.
Neutral sentiment, expectations that stock prices will stay essentially unchanged over the next six months, decreased 6.5 percentage points to 22.8%. Neutral sentiment is below its historical average of 31.5% for the 11th consecutive week.
Bearish sentiment, expectations that stock prices will fall over the next six months, decreased 4.5 percentage points to 26.4%. Bearish sentiment is below its historical average of 31.0% for the fifth time in six weeks.
The bull-bear spread (bullish minus bearish sentiment) increased 15.6 percentage points to 24.4%. The bull-bear spread is above its historical average of 6.5% for the 19th time in 20 weeks.
This week’s special question asked AAII members which factor is most influencing their six-month outlook for stocks.
Here is how they responded:
- The economy and/or inflation: 34.9%
- Monetary policy/interest rates: 28.4%
- Valuations: 14.8%
- Corporate earnings: 13.3%
- Other: 8.7%
Bullish: 50.8%, up 11.0 points
Neutral: 22.8%, down 6.5 points
Bearish: 26.4%, down 4.5 points
Bullish: 37.5%
Neutral: 31.5%
Bearish: 31.0%
See more Sentiment Survey results.

September 12, 2024 Excess CAPE Yield Low Ahead of Potential Interest Rate Cut
September 5, 2024 A Rebound in the Number of Stocks, but Share Prices Rise More
August 29, 2024 The Advantages of Combining Momentum and Equal Weighting
August 22, 2024 August Charts of Interest: A Key Indicator Now Suggests No Recession

Discussion
Rob from NC posted over 2 years ago:
"Figure 1: Comparing Income Generated by Bonds and Dividend Stocks Over the Long Term" ought to be presented REPEATEDLY on the cover of the AAII Journal. I've long asserted that fixed income instruments have no place in an individual investor's portfolio (except for those who have acquired so little for retirement that a market crash would devastate them). Younger investors, in particular, need to take note of this figure. Stick with equities!
David Gartland from New Jersey posted over 2 years ago:
I see AAII is asking for donations. For those of us who have IRA's and have reached a certain age and believe in what AAII does, we can make a tax free donation using a Qualified Charitable Distribution (QCD) from our IRA to satisfy part or all of our annual Required Minimum Distribution (RMD) since AAII is a 501 c3 non-profit. The trick is to have our IRA firm (Vanguard) cut a check to AAII before taking our RMD, otherwise you may lose the benefit in making the donation. The AAII donation will not impact our Medicare premium or Social Security taxes. AAII benefits from the knowledge they provided to the members which helped their member's IRA grow. The member's taxes are not impacted with the withdrawal from their IRA. AAII gets more money. Win-Win-Win!
Barry J from TX posted over 2 years ago:
I saw the AAII donation request. I am very thankful for what AAII has taught me about investing. However, I would rather add to the AAII revenue stream by recommending AAII to others. I also chose to invest in the AAII Premium Program to do my part and take a tax deduction as a business expense, which is a much cleaner standardized process. Messing with QCDs and relying on employees of a third-parties to execute their part in the "tricky" QCD process to the satisfaction of the IRS is a chance I am unwilling to take. Uncle Sam has a firm “NO take backs” rule that they enforce through “no exceptions or excuses” penalties and interest if ANYONE in this chain of actions gets ANYTHING wrong If something like this happens, you are on your own. Good luck on finding an IRS employee who will listen. The interest clock will still be running. An additional upside is the learning benefit from AAII Premium is a gift that keeps on giving (as long as you renew, anyway).
You need to log in as a registered AAII user before commenting.
Create an account