

Excess CAPE Yield Low Ahead of Potential Interest Rate Cut
by Charles Rotblut | September 12, 2024
With the probability of an interest rate cut occurring next week, I decided to revisit a stock market valuation measure that adjusts for interest rates: The excess CAPE yield (ECY). This ratio currently suggests the S&P 500 index’s valuation is in the top third of all historical readings.
The excess CAPE yield has its basis in Nobel laureate Robert Shiller’s cyclically adjusted price-earnings (CAPE) ratio. The CAPE ratio uses 10 years’ worth of earnings instead of one year like traditional price-earnings (P/E) ratios use. It is intended to predict stock market returns over the next five to 10 years. (The CAPE ratio is currently at 35.2, which is very high.)
The excess CAPE yield inverts the current CAPE ratio (1 ÷ CAPE) and then subtracts the real (inflation-adjusted) 10-year interest rate from it. Inversing the CAPE ratio creates a long-term, inflation-adjusted earnings yield. It is akin to the traditional earnings yield (earnings for the last four quarters divided by price, or E/P) that is used to compare stocks to bonds.
As of the start of September, the excess CAPE yield is 1.83%. This is down from its coronavirus pandemic peak of 4.88% in 2020. It is also below the long-term average of 4.63% and the long-term median of 3.36%. Lower numbers signal higher valuations since yield and valuation are inversely related.
You can observe this in the table. I grouped the individual monthly excess CAPE yields by percentile ranges. As the excess CAPE yield has increased, so have the average real (inflation-adjusted) 10-year returns realized by the S&P 500. (Each 10-year period follows the individual month an excess CAPE yield was calculated for.) Since Shiller had it in his data, I also listed the average real returns for 10-year Treasury bonds.
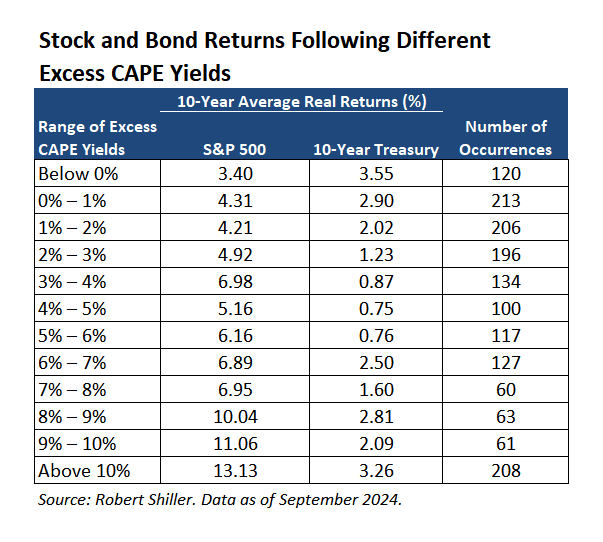
The historical data suggests—but in no way guarantees—lower real returns for the S&P 500 going forward. The average 10-year return for the S&P 500 when the excess CAPE yield has ranged between 1% and 2% is 4.21%. For context, the average 10-year return over all periods in Shiller’s data is 6.67%.
If inflation stays near its long-term average of 3% (and, yes, that is a big “if”), the numbers translate to an annualized 10-year absolute return of about 7%.
Below-average returns for the S&P 500 do not necessarily mean below-average returns for other types of stocks. As I have been pointing out, the large-cap S&P 500 is currently unusually top heavy. The 10 largest stocks accounted for 35.5% of the S&P 500’s total market capitalization at the end of August. Those same stocks are also driving up the index’s overall price-earnings ratio.
Value stocks—especially small-cap value stocks—remain historically cheap relative to the S&P 500. Foreign indexes have been experiencing an unusually long streak of underperforming the S&P 500. A swing of the pendulum could result in one or both stock categories outperforming the S&P 500 going forward. We can’t say with certainty what will happen, but we do know that diversification increases your odds of being in the right type of investment at the right time.

-
Online Exclusive: Delving Into the Definition of the CAPE Ratio
Dividing current market price by a 10-year average of earnings can be used to predict long-term performance of a stock or the market. -
Valuations, Inflation and Real Returns
An interview with Robert Shiller, where he explains why he looks at 10 years of earnings and the importance of factoring in inflation when valuing assets. -
The Truth About High-Yield Mutual Funds and ETFs
The September 2024 AAII Journal reveals how some high-yield equity funds use derivative income or covered calls to produce extra income. See how these riskier funds compare to high-yield equity funds that use conventional strategies.
AAII Sentiment Survey
Bearish sentiment among individual investors about the short-term outlook for stocks increased in the latest AAII Sentiment Survey. Meanwhile, optimism and neutral sentiment decreased.
Bullish sentiment, expectations that stock prices will rise over the next six months, decreased 5.5 percentage points to 39.8%. Bullish sentiment is above its historical average of 37.5% for the 44th time in 45 weeks.
Neutral sentiment, expectations that stock prices will stay essentially unchanged over the next six months, decreased 0.5 percentage points to 29.3%. Neutral sentiment is below its historical average of 31.5% for the 10th consecutive week.
Bearish sentiment, expectations that stock prices will fall over the next six months, increased 6.0 percentage points to 31.0%. Bearish sentiment reached its historical average of 31.0% for the first time in five weeks.
The bull-bear spread (bullish minus bearish sentiment) decreased 11.6 percentage points to 8.8%. The bull-bear spread is above its historical average of 6.5% for the 18th time in 19 weeks.
This week’s special question asked AAII members about their perception of the current state of the housing market.
Here is how they responded:
- Strong: 9.8%
- Mixed: 55.7%
- Weak: 29.1%
- Not sure/no opinion: 5.3%
Bullish: 39.8%, down 5.5 points
Neutral: 29.3%, down 0.5 points
Bearish: 31.0%, up 6.0 points
Bullish: 37.5%
Neutral: 31.5%
Bearish: 31.0%
See more Sentiment Survey results.

September 5, 2024 A Rebound in the Number of Stocks, but Share Prices Rise More
August 29, 2024 The Advantages of Combining Momentum and Equal Weighting
August 22, 2024 August Charts of Interest: A Key Indicator Now Suggests No Recession
August 15, 2024 Profit by Buying the S&P 500's Castoffs

Discussion
Barry J from TX posted over 2 years ago:
Charles, a great article for a Friday the 13th. Before being anointed as an economic guru by a Swedish Bank, Shiller made his fame by using CAPE to predict the 2008 Great Recession, but never forget his product is selling CAPE. In 2003, he wrote "Is There a Bubble in the Housing Market?" In 2005, he warned that "further rises in markets could lead to even more significant declines ... A long-run consequence could be a decline in consumer and business confidence, and possibly worldwide recession." In a 2006 WSJ article Shiller again warned that "there is significant risk of a possible recession sooner than most of us expected" and in September 2007, a year before the collapse of Lehman Brothers, Shiller predicted an imminent collapse in the US housing market and a subsequent financial panic. Wow! And, on this famous bewitching day, you give Dr. Schiller the opportunity to keep his streak going. The XCY data you recapitulate strongly tilts the prediction positive for higher market valuations to come. XCY is at 1.83% below its peak of 4.88% (that’s a good sign) … AND … below its 4.63% LT average (that’s a good sign) … AND below its 3.36% LT Median (that’s a third good sign in a row), Schiller’s XCY is tilts toward signaling expectations for higher market valuations. But hark! Even though they do not rely on fancy-spancy inverted formulas … or anyone else’s opinion, the local coven of AAII mystics agree with Dr. Schiller. AAII Bulls dominate AAII Bears by an 8.8% spread. I would be “all in” after these magically aligned predictions from such celebrated sages, but this good news comes on a Friday the Thirteenth, I stepped on a crack while I was walking this morning, we are double-daring Mr. Market to vote on this, and we are depending on a Fed that is famous for getting its coin-flips wrong more times than right and that coven of witches has its bony fingers on the go-no go button.
You need to log in as a registered AAII user before commenting.
Create an account