

Monitoring My Portfolio During a Volatile Market
by Charles Rotblut | November 10, 2022
I wrote the draft of this week’s Investor Update commentary prior to the release of better-than-expected October inflation numbers. Today’s jump in the financial markets does not change much. The late Jack Bogle’s advice about not looking at your portfolio until the day you retire still remains valid.
I will just add to Bogle’s advice that looking at your portfolio isn’t the problem. Rather, it’s what you do in response to looking at your portfolio—particularly when the market is down or just highly volatile.
Data from both Morningstar Inc. and Dalbar Inc. show that the timing of investors’ buy and sell decisions leads them to realize lower returns than the funds they actually invest in. While some of these decisions are attributable to failed attempts at timing the market, a large number are also attributable to investors having looked at their portfolios and feeling the urge to act when the portfolio was down. 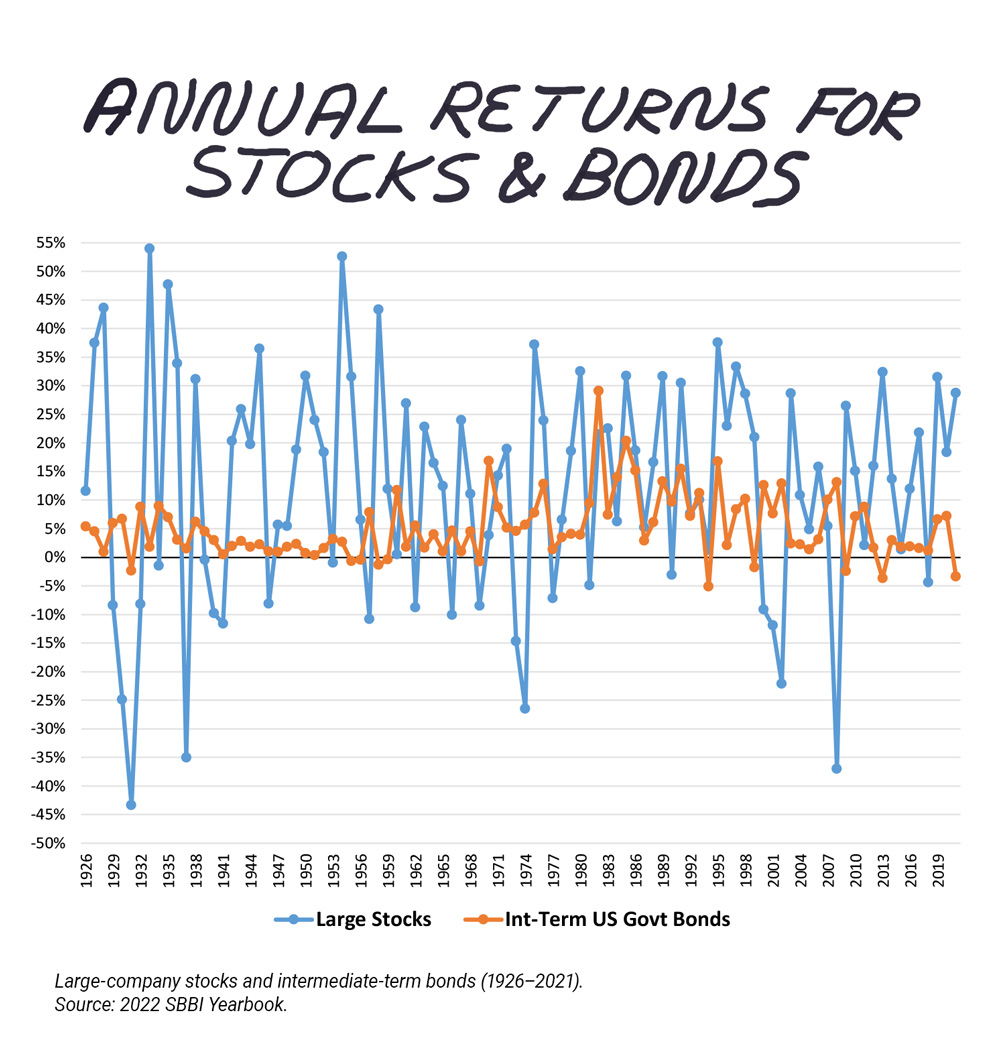
I’m personally a believer in rules-based approaches. Such approaches provide clarity about what to do and what not to do. For me, a key rule is to review my 403(b) account’s allocation at the end of October and the end of April every year. These dates correspond with the start of the “best” six months (November–April) and the worst six months (May–October) for the stock market.
If each of the five funds I hold are within five percentage points of their target 20% portfolio weightings, I do nothing. If any are outside of this range, I rebalance the entire account back to its equal-weighted target. When I recently looked at my account for the first time in six months, all five funds were within the acceptable range of variance. So, I did nothing but log out of the account.
The allocations were within their target range because all five funds are down year to date. Yes, that is a lousy reason to have your portfolio allocation remain close to target. It does demonstrate how returns for bonds and stocks—which tend to be uncorrelated over longer periods—can sometimes converge.
Here’s my 403(b) allocation and each fund’s year-to-date return as of October 31, 2022:
- Vanguard 500 Index Admiral fund (VFIAX): –17.7%
- Vanguard Intermediate-Term Investment-Grade Admiral fund (VFIDX): –17.1%
- Vanguard Small-Cap Value Index Admiral fund (VSIAX): –9.0%
- Vanguard FTSE All-World ex-US Small-Cap Index Admiral fund (VFSAX): –28.0%
- Vanguard Real Estate Index Admiral fund (VGSLX): –26.8%
One thing of note—besides the (ahem) negative returns—is the comparative performance of the S&P 500 (large-cap stock) fund and intermediate-term bond fund. Both are down by approximately the same amount year to date. It’s unusual to see both on track to be down for a full calendar year.
Between 1926 and 2021, there were only two years when both large-company stocks and intermediate-term government bonds were both down in the same calendar year. Those years were 1931 and 1969.
We’re not tracking data on intermediate-term corporate bonds. The data we do have from the Ibbotson SBBI Yearbook shows large-company stocks and long-term corporate bonds both being down during only 10 calendar years (1937, 1941, 1946, 1966, 1969, 1973, 1974, 1977, 1981 and 2018).
What these numbers tell you is that it is unusual for both large-cap stocks and intermediate-term bonds to be down in the same calendar year. Diversification has simply hit a rough spot this year. No portfolio strategy works all the time, but over longer periods historical trends do tend to hold up.
I find looking at market history during periods when the market is down or volatile to be helpful. It helps change the framing from the way too prevalent short-term view to a long-term perspective. And maintaining the long-term perspective keeps me from being reactive to short-term market movements—be they negative, like the first 10 months of this year, or positive, like they were today.

-
Six Questions With John Bogle
The founder of Vanguard explains how investors can maximize long-term wealth and gives advice for how to get grandchildren interested in investing. -
The Importance of Rebalancing for Retirees and Other Investors
Analysis of rolling 25-year periods showed rebalancing can lead to greater ending wealth for a hypothetical retirement portfolio by shifting dollars from bonds to equities during bear markets. -
Key Ingredients of a Blue-Chip REIT
High-quality REITs can deliver consistent, rising growth in funds from operations, dividends and asset value over reasonably long periods of time. -
Best of the Web: Seven Key Sites for Investors
These handpicked websites stand out as leaders in their respective fields, providing free access to quality data and tools. -
The Carrie Finances: Dragging My Savings Habits
Anine Sus makes behavioral changes to help her save better in her latest My Investing Discoveries blog post.
AAII Sentiment Survey
Pessimism among individual investors about the short-term direction of the stock markets rebounded strongly after having fallen to a seven-month low last week. The latest AAII Sentiment Survey also shows drops in both bullish and neutral sentiment.
Bullish sentiment, expectations that stock prices will rise over the next six months, fell 5.5 percentage points to 25.1%. The drop keeps bullish sentiment below its historical average of 38.0% for the 51st consecutive week. It is also unusually low for the 33rd time in 45 weeks. The breakpoint between typical and unusually low readings is currently 27.5%.
Neutral sentiment, expectations that stock prices will stay essentially unchanged over the next six months, plunged by 8.7 percentage points to 27.9%. The pullback puts neutral sentiment below its historical average of 31.5% for the 26th time in 29 weeks.
Bearish sentiment, expectations that stock prices will fall over the next six months, jumped by 14.1 percentage points to 47.0%. Pessimism is above its historical average of 30.5% for the 50th time out of the past 51 weeks. It is also at an unusually high level for the 34th time out of the last 43 weeks. The breakpoint between typical and unusually high readings is currently 40.7%.
The bull-bear spread (bullish minus bearish sentiment) is –22.0% and is unusually low for the 33rd time in 42 weeks. The breakpoint between typical and unusually low readings is currently –11.4%.
Historically, the S&P 500 index has gone on to realize above-average and above-median returns during the six- and 12-month periods following unusually low readings for bullish sentiment and the bull-bear spread. Unusually high bearish sentiment readings historically have also been followed by above-average and above-median six-month returns in the S&P 500.
Even with the rebound in the major stock indexes, individual investors’ short-term expectations are still being influenced by continued volatility in the major stock indexes along with inflation, corporate earnings and increased chatter about the possibility of a recession. Also influencing sentiment are monetary policy, politics and the ongoing invasion of Ukraine by Russia.
Bullish: 25.1%, down 5.5 points
Neutral: 27.9%, down 8.7 points
Bearish: 47.0%, up 14.1 points
Bullish: 38.0%
Neutral: 31.5%
Bearish: 30.5%
See more Sentiment Survey results.

November 3, 2022 Investment Horror Tales and Their Lessons
October 27, 2022 Introducing AAII's Growth Investing Newsletter
October 20, 2022 Sustainable Growth Stocks and How to Find Them
October 13, 2022 Plans and Rules Work for Both Marathons and Investing

Discussion
Barry from TX posted over 3 years ago:
Charles, kudos on sharing your portfolio’s YTD performance data as a model to reinforce the paramount importance of the values of patience and discipline in managing portfolios over the long term. Values that veterans can uniquely appreciate as a way of life. Greetings to all my fellow veterans on this Veterans Day. Semper Fi to the Corps on its 224th anniversary yesterday. It was the CHOICE to serve that makes possible for all Americans to be able to improve their lives through access to free markets in a free country. Career veterans devote 20 to 30+ years of their lives in service to their country. High pay is not one of the expected benefits. Focus on the mission, not on the market, is expected. Moving frequently and living overseas are also expected. Many veterans lacked the time and money to invest until after they completed their service. They “lost” 2-3 decades as an investor. One of the basic principles of PRISM is to start investing as early as you can. If, for some reason -- including military service, you “wait” until age 40 or 50 before you start your investing career, you have reduced your terminal earnings as much as 50%. For example, under the Rule of 72 – (you can estimate an expected ROI by dividing the number 72 by the number of years you are invested) –and using a lower-then-average long-term market return of 7% (Siegel and others have found it was closer to 8%), investments at 7% double about every 10 years. That means uninvested veterans may have foregone from 200% to 400% of their total lifetime wealth accumulation. We all know what Lincoln first recognized as "the last full measure of devotion" as he dedicated the cemetery at Gettysburg in 1863. It's what Memorial Day is all about. I hope this simple exercise helps estimate the value of choosing “devotion to Duty, Honor, and Country” over the pursuit of “life, liberty and happiness” through economic wealth. “Sir, yes sir! Three bags full, sir!” (A phrase from the nursery rhyme, ‘Baa, baa, black sheep,’ understood by military people to be an acceptable humorous, sometimes sarcastic, response (used with different inflections to indicate various degrees willingness) to do something their superiors think to be a difficult, if not impossible, “ask.")
Barry from TX posted over 3 years ago:
I reread this article in Jan 2023. First of all, I used the advice to partition the annual portfolio evaluation cycle into two halves based on "best" and "worst" 6 months periods. Second, I remembered there was also a fascinating factoid in the same article. "Between 1926 and 2021, there were only two years when both large-company stocks and intermediate-term government bonds were both down in the same calendar year. Those years were 1931 and 1969." I guess we need to add 2022 to our "WOAT" -- Worst of All Time -- markets list. Statistical process control and aircraft maintenance, and aviation safety use a measure called "Mean Time Between Failures" to calculate and compare the relative magnitude and the predictability of adverse events. There are too few data points here to use MTBF. Benoit Mandelbrot - who was famous for his contention that large swings in financial markets are not random, due to "long-term dependencies" across time - invented a measure for such situations that can be used to determine if there is any causality in such a series -- R/S - Rescaled Range Analysis. Calculating this type of statistic is "way above my pay grade," but it seems smug to dismiss and ignore it. It points to the limitations of depending on a normal distribution to provide answers to how to predict "outlier" events somewhere beyond 6 standard deviations to the left of the mean. Labeling it a "Black Swan" just does not provide any additional understanding of how we can predict future events. In "Stocks for the Long Run!" Nobelist Jeremy Siegel says it took until 1953 or so -- about a quarter of a century -- for investors in the 1929 crash to get back to breakeven. At least, the 2022 losses are much smaller (about 3 times) than the 1929 losses. Let's hope the magnitudes of "outlier" market events are logarithmically scalable similar to Richter's scale here. But how would we know if the only tool we use to compare WOAT events is a normal distribution?
Barry from TX posted over 3 years ago:
I reread this article in Jan 2023. First of all, I used the advice to partition the annual portfolio evaluation cycle into two halves based on "best" and "worst" 6 months periods. Second, I remembered there was also a fascinating factoid in the same article. "Between 1926 and 2021, there were only two years when both large-company stocks and intermediate-term government bonds were both down in the same calendar year. Those years were 1931 and 1969." I guess we need to add 2022 to our "WOAT" -- Worst of All Time -- markets list. Statistical process control and aircraft maintenance, and aviation safety use a measure called "Mean Time Between Failures" to calculate and compare the relative magnitude and the predictability of adverse events. There are too few data points here to use MTBF. Benoit Mandelbrot - who was famous for his contention that large swings in financial markets are not random, due to "long-term dependencies" across time - invented a measure for such situations that can be used to determine if there is any causality in such a series -- R/S - Rescaled Range Analysis. Calculating this type of statistic is "way above my pay grade," but it seems smug to dismiss and ignore it. It points to the limitations of depending on a normal distribution to provide answers to how to predict "outlier" events somewhere beyond 6 standard deviations to the left of the mean. Labeling it a "Black Swan" just does not provide any additional understanding of how we can predict future events. In "Stocks for the Long Run!" Nobelist Jeremy Siegel says it took until 1953 or so -- about a quarter of a century -- for investors in the 1929 crash to get back to breakeven. At least, the 2022 losses are much smaller (about 3 times) than the 1929 losses. Let's hope the magnitudes of "outlier" market events are logarithmically scalable similar to Richter's scale here. But how would we know if the only tool we use to compare WOAT events is a normal distribution?
You need to log in as a registered AAII user before commenting.
Create an account