

The State of the U.S. Financial Markets as of Midyear 2025
by Charles Rotblut | July 03, 2025
This year has been a tale of two quarters for the stock market.
Mr. Market was in a risk-off mood during the first quarter. The S&P 500 Low Volatility index rose 7.3%, while the S&P 500 Dividend Aristocrats index rose 3.2%. The more volatile S&P 500 High Beta and S&P 500 Growth indexes fell 11.5% and 8.5%, respectively.
In April, Mr. Market changed his mood and went into risk-on mode. The S&P 500 High Beta jumped 24.9%, while the S&P 500 Growth rose 18.9% during the second quarter. In contrast, the S&P 500 Low Volatility and the S&P 500 Dividend Aristocrats pulled back 2.0% and 0.8%, respectively.
A Rip Van Winkle-type of investor who napped throughout the first half of 2025 before waking up on Tuesday would have thought it was a good year for stocks given the S&P 500 index’s year-to-date gain of 6.2%.
Of course, a lot happened over the past six months. The U.S. implemented a slew of higher tariffs, before lowering or pausing some. Israel and Iran engaged in war, and the U.S. bombed Iranian nuclear facilities. Presidential pressure was placed on Federal Reserve chairman Jerome Powell to reduce interest rates. Gold set numerous record highs, including a closing price above $3,400.
Valuations remain pricey for large-cap stocks. J.P. Morgan Asset Management said that the S&P 500’s forward price-earnings (P/E) ratio was 22.0 at the end of June. This was well above the 30-year average of 17.0. (Small-cap stocks remain cheap.)
The S&P 500’s Forward Price-Earnings Ratio Is High
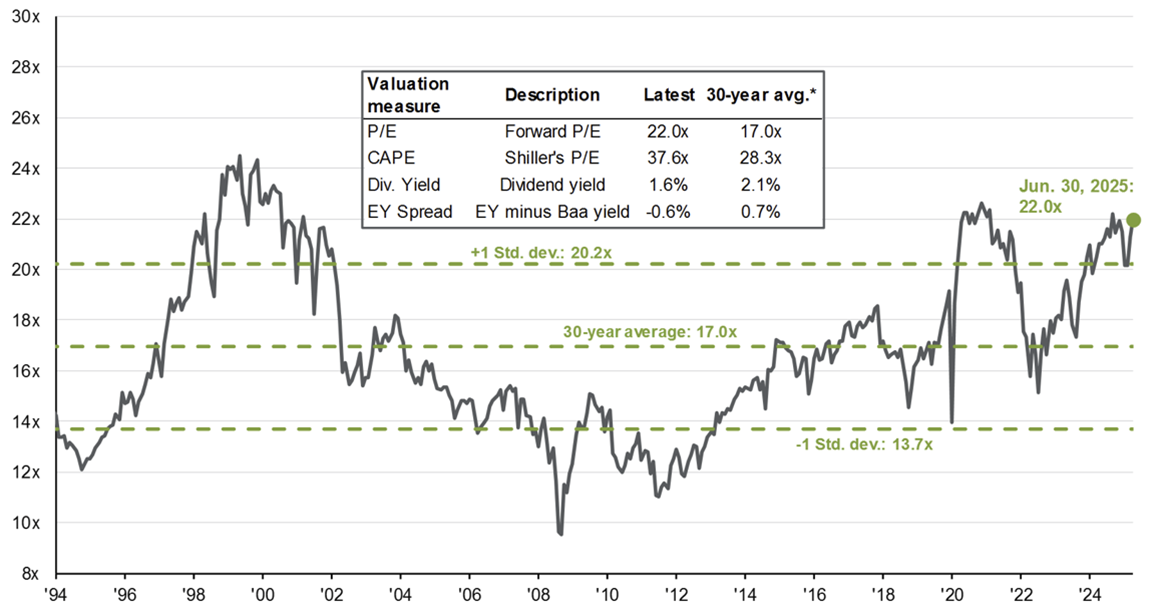
Source: J.P. Morgan Guide to the Markets. Data as of 6/30/2025.
The high valuation reflects the ongoing large concentration of the S&P 500’s 10 largest stocks. Those stocks accounted for 38.2% of the index’s total market capitalization at the end of June—a high percentage.
Technology and communication services—the sectors containing most of the S&P 500’s 10 largest stocks—are projected to show strong second-quarter 2025 earnings growth. Analysts expect the technology companies to report 17.7% growth and communication services companies to report 31.8% growth, according to LSEG I/B/E/S. The S&P 500 is projected to grow 5.8%.
For full-year 2025, S&P 500 earnings are forecast to rise 8.5%. Put another way, despite all of this year’s uncertainty, analysts continue to expect earnings growth.
U.S. companies operating abroad have had to contend with a weaker dollar. The greenback weakened against the euro, yen and British pound over the past six months.
The weaker dollar has been blamed, in part, for impacting U.S. Treasury yields. Yet, yields on the 30-year Treasury bond ended June exactly where they ended 2024. Yields for the two-, five- and 10-year Treasury notes were lower at the end of June than they were at the end of December.
Current Bond Yields Relative to the Start of 2025
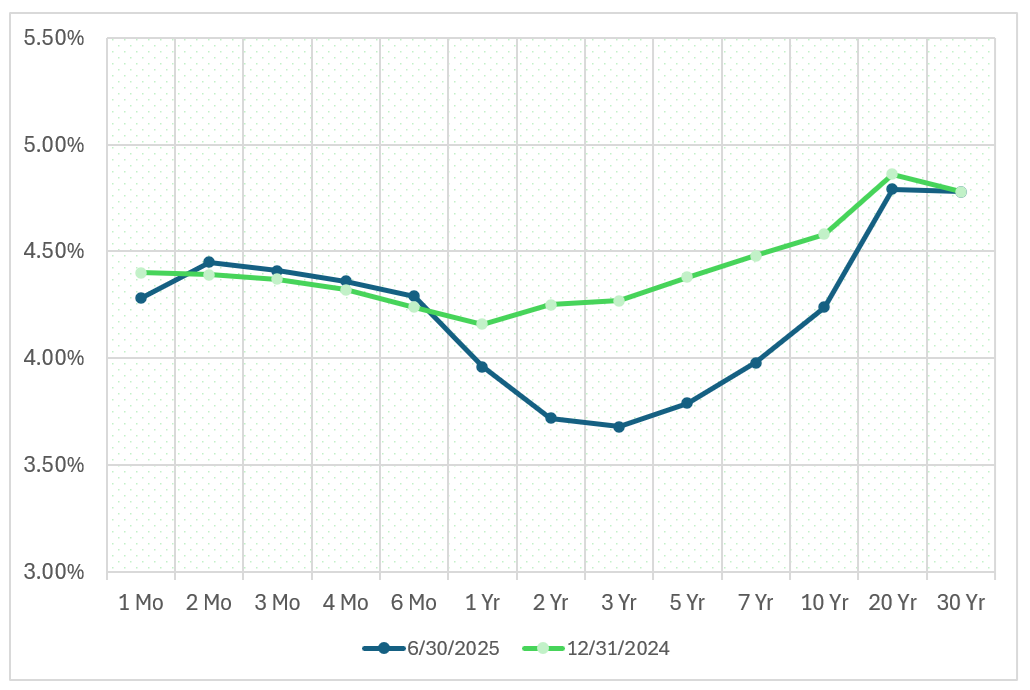
Source: U.S. Department of the Treasury. Data as of 6/30/2025.
Inversion has become more pronounced in the middle of the bond curve, though yields are higher for the 30-year bond than for short-term bonds. A decline in foreign buyers is among the reasons cited for the long bond’s higher yields.
Futures traders believe the Fed will resume lowering interest rates at its September meeting. The CME FedWatch Tool shows an 80% probability of at least two interest rate cuts being made before the end of the year. These odds are very much subject to change.
So, what are the takeaways for long-term investors? Here are a few of my thoughts:
- It pays to not pull out of stocks when uncertainty is high. Those who stayed with stocks during this year’s correction were rewarded for doing so.
- There remains a high level of politically driven uncertainty across the globe. Making big bets on uncertain outcomes is not a profitable strategy. If it was, there wouldn’t be so many online sports betting platforms.
- The stock market is forward-looking. Collectively, investors currently foresee continued earnings growth.
- Small-cap stocks remain historically undervalued relative to large-cap stocks. This provides opportunities for those who are patient and believe that valuation spreads will again move back toward their historical averages.
- The middle of the bond curve could become more attractive once the yield curve uninverts.
The Power of Sentiment Indicators
AAII Sentiment Investing is launching soon.
Check out which indicators we are tracking on our dashboard!
AAII Sentiment Investing isn’t about shortcuts. It’s about giving you the tools to make smarter decisions.
With indicators measuring sentiment, market breadth, trends and volatility, you’ll gain a deeper understanding of the market’s mood.
No magic button, just powerful insights that complement your strategy.
Join our prelaunch list for the upcoming release date and more info.

-
Incorporating the Price-Earnings Ratio Into Your Screening and Analysis
The price-earnings ratio is widely used as a valuation metric because of its simplicity. It embodies the market’s expectation of future company performance and relates it to actual, recent company performance. -
Identifying Future Economic Changes With the Yield Curve
The Treasury yield curve inverts when investors foresee weaker economic conditions ahead. -
Supercharge Your Portfolio With a Nontraditional Index Fund
The payoff of a custom index approach that takes advantage of academic research can be substantial, as discussed in the newly released July 2025 AAII Journal.
AAII Sentiment Survey
Optimism among individual investors about the short-term outlook for stocks increased in the latest AAII Sentiment Survey. Meanwhile, neutral sentiment and pessimism decreased.
Bullish sentiment, expectations that stock prices will rise over the next six months, increased 9.9 percentage points to 45.0%. Bullish sentiment is above its historical average of 37.5% for the first time in six weeks and was last higher on December 5, 2024 (48.3%).
Neutral sentiment, expectations that stock prices will stay essentially unchanged over the next six months, decreased 2.8 percentage points to 21.9%. Neutral sentiment is below its historical average of 31.5% for the 50th time in 52 weeks.
Bearish sentiment, expectations that stock prices will fall over the next six months, decreased 7.2 percentage points to 33.1%. Bearish sentiment is above its historical average of 31.0% for the 31st time in 33 weeks.
The bull-bear spread (bullish minus bearish sentiment) increased 17.1 percentage points to 11.9%. The bull-bear spread is above its historical average of 6.5% for the first time in 22 weeks.
This week’s special question asked AAII members their opinion on the new tax legislation, the One Big Beautiful Bill Act, being debated in Congress.
Here is how they responded:
- It raises the national deficit too much: 64.4%
- I generally like it: 18.2%
- It cuts government spending too much: 7.2%
- It doesn’t cut taxes enough: 3.8%
- Not sure/no opinion: 6.2%
Bullish: 45.0%, up 9.9 points
Neutral: 21.9%, down 2.8 points
Bearish: 33.1%, down 7.2 points
Bullish: 37.5%
Neutral: 31.5%
Bearish: 31.0%
See more Sentiment Survey results.

AAII Asset Allocation Survey
Individual investors’ allocations to stocks increased while bond and cash allocations decreased in the June Asset Allocation Survey.
Stock and stock fund allocations increased 3.2 percentage points to 67.5%. Stock and stock fund allocations are above their historical average of 61.5% for the 61st consecutive month.
Bond and bond fund allocations decreased 0.2 percentage points to 15.9%. Bond and bond fund allocations are below their historical average of 16.0% for the 15th time in 17 months.
Cash allocations decreased 3.0 percentage points to 16.6%. Cash allocations are below their historical average of 22.5% for the 31st consecutive month.
- Stocks and Stock Funds: 67.5%, up 3.2 percentage points
- Bonds and Bond Funds: 15.9%, down 0.2 percentage points
- Cash: 16.6%, down 2.9 percentage points
- Stocks: 32.2%, up 2.6 percentage points
- Stocks Funds: 35.3%, up 0.5 percentage points
- Bonds: 5.1%, down 0.4 percentage points
- Bond Funds: 10.8%, up 0.2 percentage points
- Stocks/Stock Funds: 62.0%
- Bonds/Bond Funds: 16.0%
- Cash: 22.0%
Take the Asset Allocation Survey.
June 26, 2025 The Case for Free Cash Flow in Stock Selection
June 19, 2025 June Charts of Interest: Tariffs Are Driving Prices Bananas
June 12, 2025 Don't Mistake MicroStrategy's 10% Preferred Yield for Pure Bitcoin Exposure
June 5, 2025 Six Minutes?! Study Finds That Investors Often Skip Proper Stock Research

Discussion
Rob from NC posted over 1 year ago:
In other words, the market is a jumbled-up mess. But it's ALWAYS a jumbled-up mess. Charles states, "Those who stayed with stocks during this year’s correction were rewarded for doing so." That is ALWAYS true (in the long run). All of the prognostications mentioned in this piece could have been made at any time in the past. How many of them came true? NOBODY knows what the Fed will do in September, what next year's earnings will look like, or what the political climate will be in six months. Those who think they know are fooling themselves. That's why I keep my head down, ignore the sort of noise Charles discusses, and stay the course with my 100% allocation to equities, come what may. It has worked well for me for more than 40 years.
Barry from Texas posted over 1 year ago:
Charles, I estimate your overall theme is about handling abrupt changes. In 2025, we have a new risk-on factor. Our new POTUS is insouciant about how his aggressive negotiating style impacts financial markets. Bette Davis's advice in "All About Eve" -- "Fasten your seatbelts, it's going to be a bumpy night." -- would serve all long-term investors well as we lurch forward. Although we were only down 12%, the (04/02) "Liberation Day" tariff announcements dented our portfolio balance by more than a year's income flow, but we recovered all those "paper losses" by the time the "One Big Beautiful Bill" came along (07/04) and created the sentiments captured in this week's AAII question of the week. One of the great curses from somewhere in history is, "May you live in interesting times." The "curse" of long-term investors is that as you become a more successful investor, the magnitude of paper losses from market "downturns" compounds. (I love that term "downturn". (It sounds so innocuous. It suggests you are preparing for a comfortable sleep.) Our "diversified" portfolio - comprising large cap 40% + cyclical sectors 25% + broad market 25% + cash 10% - is remarkably similar to buying an e-ticket at Disneyland. Thanks to AAII (and Dr. Bob's persistence messaging) for fortifying our ability to persist (fastened "seat belts" ON) as we experience the interesting times of our shared futures.
Barry from Texas posted about 1 year ago:
The "Current Bond Yields Relative to the Start of 2025" graph is described as "inversion has become more pronounced in the middle of the bond curve, though yields are higher for the 30-year bond than for short-term bonds." Fair enough, but the bigger problem is that this graph and the description DISTORT the impact of the long-term interest rate curve because it compares EQUAL TIME proportions. A horizontal scale using ACTUAL TIME proportions -- so 30 years is 360 times longer than 1 mo -- would SMOOTH OUT the "inversions" so they reflect the relatively DECREASING RISK - and thus lower VOLATILITY -- for choosing to hold LT USTs with INCREASING periods. Recent research demonstrates that the long-term "equity risk premiums" of the prior 50 years are DECREASING. Inversions only matter to speculators. A UST10 investor -- like an institutional investor or long-term investor like Warren Buffett -- would be earning about 40 basis points MORE during EACH of the 30 annual periods over 30 years compared to current short-term (money market fund) investors AND not have to worry about what interesting market events occur from 2025 to 2055.
You need to log in as a registered AAII user before commenting.
Create an account