

June Charts of Interest: Tariffs Are Driving Prices Bananas
by Charles Rotblut | June 19, 2025
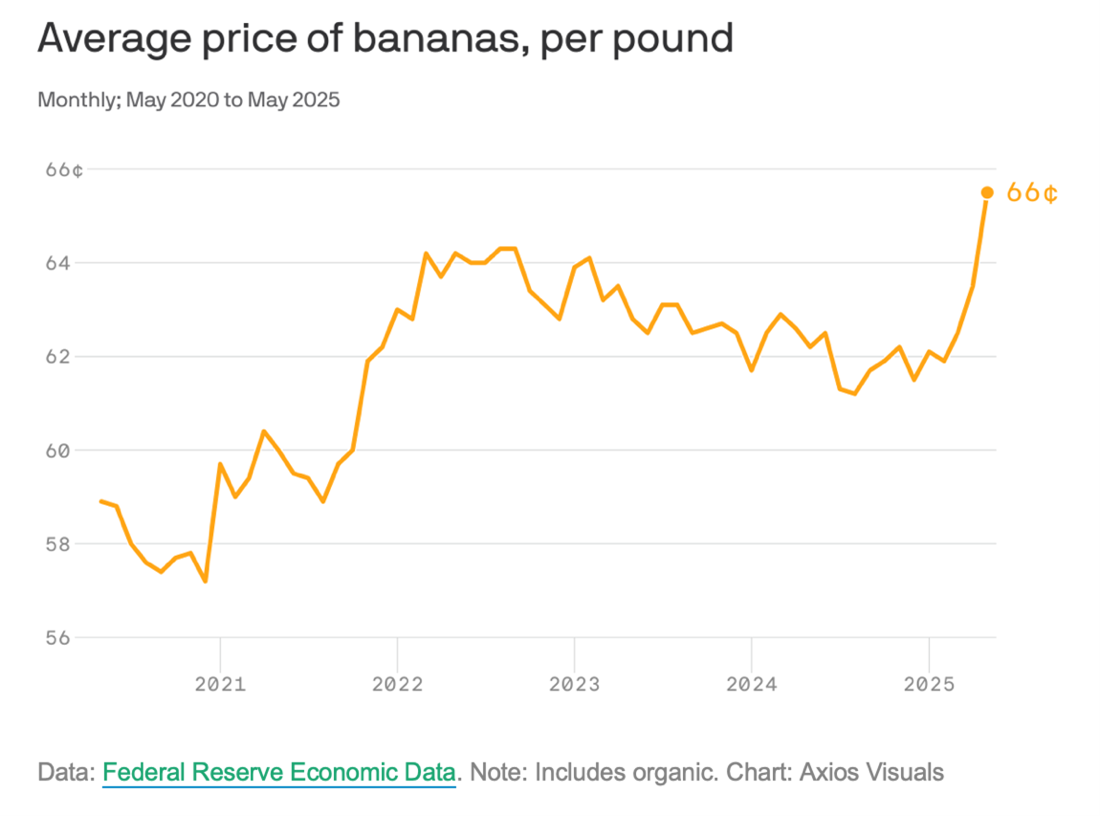
Trader Joe’s charged $0.19 per banana for many years. Then last year, the grocer raised the price to $0.23 per banana. Further increases are a possibility since the May consumer price index (CPI) report showed that banana prices are continuing to climb.
Blame tariffs for the latest increase. As Axios points out, the short shelf life of bananas made it impossible for importers to stockpile them before this year’s new tariffs went into effect.
The free banana given out to runners at the end of races just got more valuable.
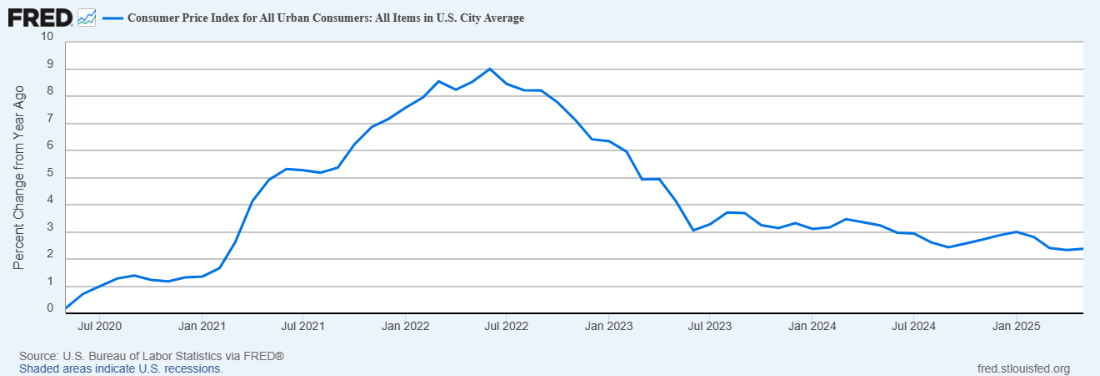
Overall Inflation Has Yet to React to Tariffs
The CPI increased by a very modest 0.1% on a seasonally adjusted basis in May. Over the last 12 months, the index that includes all items increased 2.4% before seasonal adjustment. (Bananas have very little impact on the CPI.)
Core inflation, which excludes food and energy, also rose 0.1% in May. Core inflation is up 2.8% on a 12-month basis. This is a sign that tariffs have yet to impact overall inflation, though it is likely too early to see the impact.
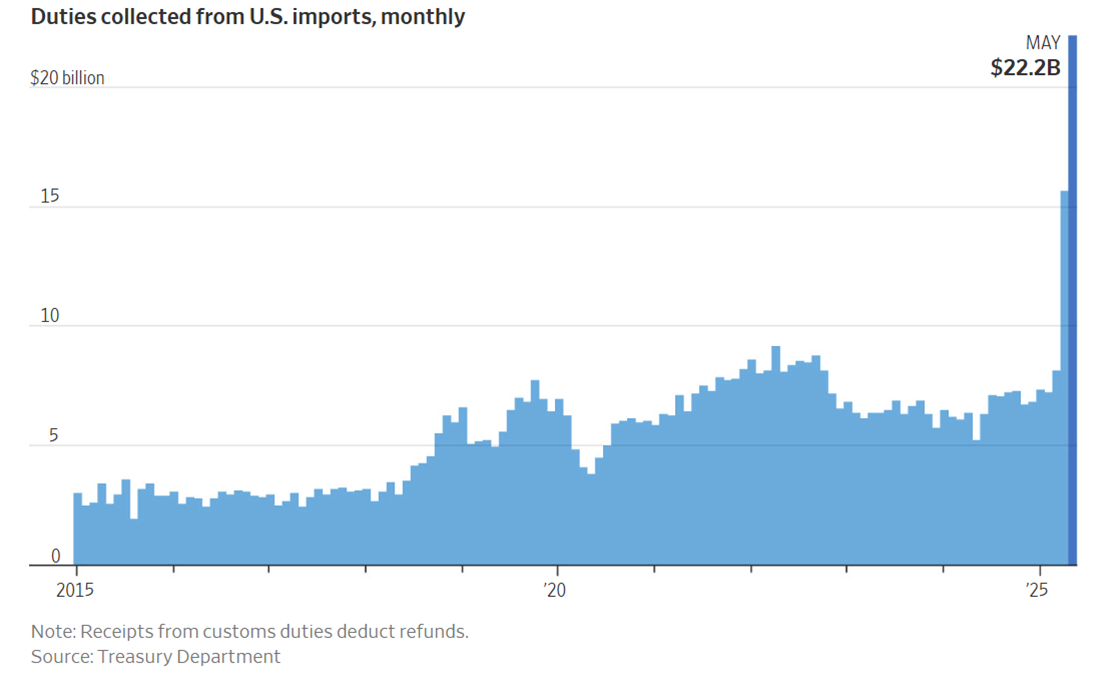
Nonetheless, Tariff Revenue Soared Again
According to The Wall Street Journal, the U.S. government collected $22.2 billion in tariffs in May, up from the already large $15.6 billion collected in April. (Bananas were also only a small part of this.) Hopefully, the U.S. and China have reached a détente regarding trade.
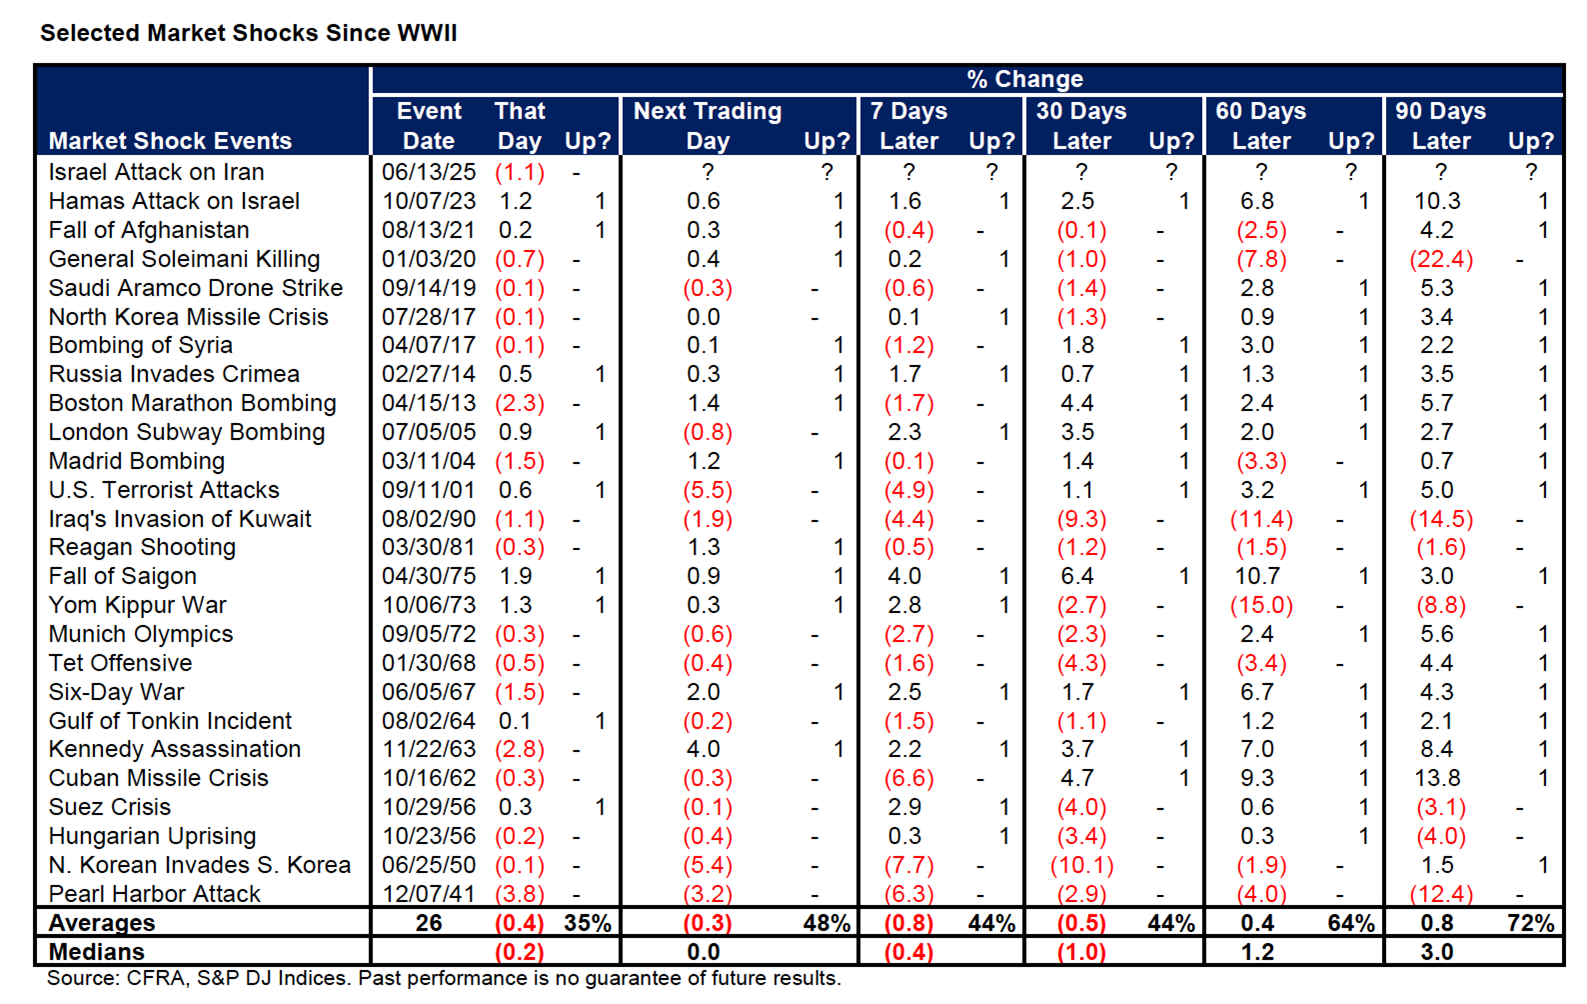
Stock Gains Have Typically Followed Geopolitical Shocks
Speaking of things going bananas, the Israel-Iran conflict has added to the Middle East’s instability. So, let’s look at how stocks have historically responded to geopolitical shocks.
“Based on the 25 selected market shocks since [World War II], a majority (65%) resulted in a one-day decline in the S&P 500 [index] averaging 0.4%,” wrote CFRA Research’s Sam Stovall in his weekly Sector Watch report. “Yet following most shocks, investors concluded that these events would not adversely impact global economic conditions, causing the S&P 500 [to] recover these losses in a matter of days or weeks.”
His data is displayed in the chart below. The S&P 500 was higher 60 days after a market shock event nearly two-thirds of the time. The U.S. economy has generally fared well too, but not always. “Three military shocks, among others, that either triggered or accompanied recessions and bear markets include the Iraqi invasion of Kuwait, the Yom Kippur War and the surprise attack on Pearl Harbor,” commented Stovall.
The Israel-Iran conflict is still ongoing as I write this on Wednesday. Let’s hope it does not escalate and cooler minds prevail. (I know, that’s a big ask for the Middle East.)
Small-Cap Stocks Remain on Sale Across the Globe
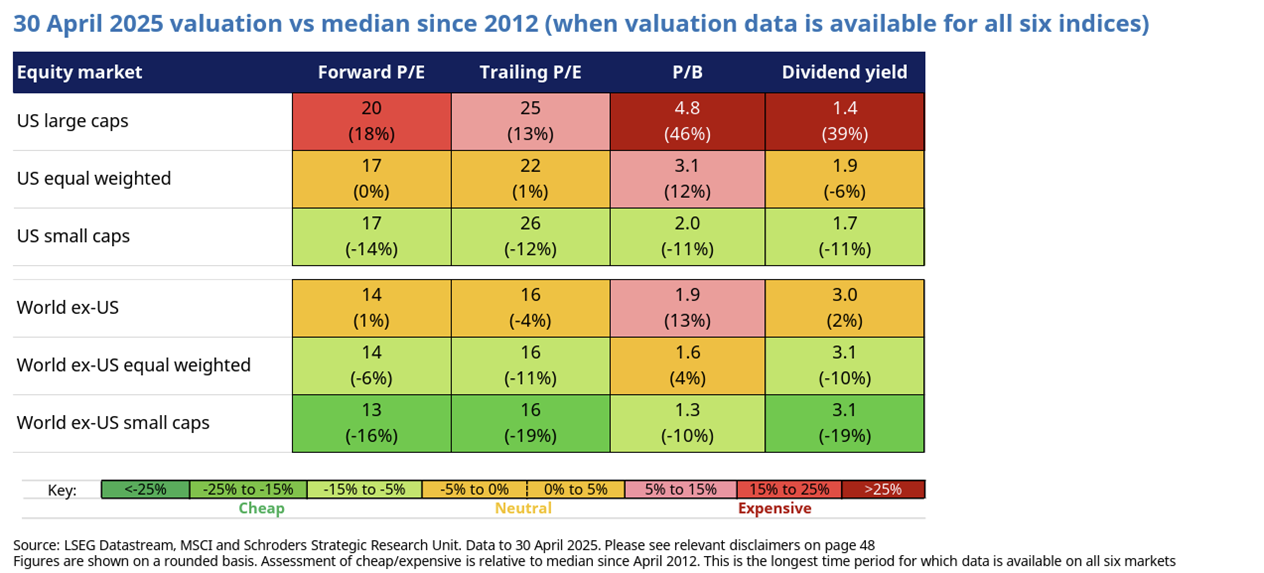
Value-oriented investors seeking bargains can find many options among small-cap stocks—not just here in the U.S., but in other countries as well. The table below from Schroders’ May 2025 Equity Lens report shows small-cap stocks trading at valuation ratios below their 13-year averages (indicated by the boxes shaded in green).
Bonds Cushion the Volatility of Stocks, But Not Always
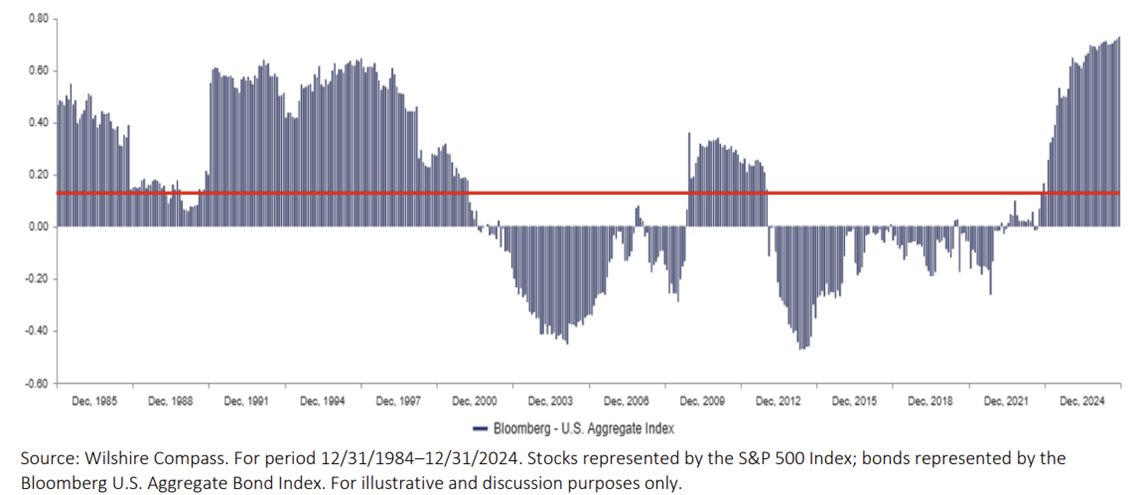
Stocks and bonds have been good portfolio partners because of their low correlations. Wilshire calculates the average correlation between the S&P 500 and the Bloomberg U.S. Aggregate Bond index as 0.15. (A correlation of 0.0 signals returns as being fully independent of each other.)
This average correlation masks the swings that have occurred over time. Correlations between stocks and bonds have soared since the pandemic because both were adversely affected by high inflation. The current period of high correlations follows a decade of below-average correlations.
Most Investors Miss This Signal Before a Reversal
The strongest signals often come not from data, but from emotion.
What comes before a major market shift?
It’s rarely just fundamentals. Often, it’s a change in behavior — a burst of optimism or panic, a turn in sentiment that precedes any shift in earnings or guidance.
When you can recognize those emotional extremes, you’re able to make more disciplined decisions — decisions grounded in evidence, not emotion.
That’s what we’re building:
A tool to help you recognize the underlying emotional cycles at work and understand when investors are reacting — not thinking.
Want to be among the first to explore it when it’s ready?
Interested? Get release updates.

-
Tips About Treasury Inflation-Protected Securities
TIPS can be useful in protecting against unanticipated inflation, although they do not eliminate interest rate risk entirely. -
Small-Cap Value Is the Best Choice for Equity Diversification
Any long-term portfolio anchored by the S&P 500 can benefit from the addition of small-cap value stocks. -
The Put-Call Ratio: Viewing Market Sentiment Through Options Activity
The June 2025 AAII Journal explains how the CBOE equity put-call ratio can inform your judgment during periods of fear or euphoria by showing where market sentiment may have gone too far.
AAII Sentiment Survey
Bullish: 33.2%, down 3.5 points
Neutral: 25.4%, down 4.4 points
Bearish: 41.4%, up 7.8 points
Bullish: 37.5%
Neutral: 31.5%
Bearish: 31.0%
See more Sentiment Survey results.

June 12, 2025 Don't Mistake MicroStrategy's 10% Preferred Yield for Pure Bitcoin Exposure
June 5, 2025 Six Minutes?! Study Finds That Investors Often Skip Proper Stock Research
May 29, 2025 The Bond Market Is Adjusting, Not Growling
May 22, 2025 May Charts of Interest: The Impact Tariffs Are Already Having

Discussion
Barry from TX posted over 1 year ago:
Charles, gotta love the bananas' puns. #1 I recommend readers review Stovall’s AAII article on the subject of market drawdown probabilities and recovery times from his 2017 “Stock Market Retreats and Recoveries” article @ https://www.aaii.com/journal/article/stock-market-retreats-and-recoveries. The datapoints in Stovall's chart reduce to these probabilities. Since WWII [1945 or 72 years ago], there have been 56 pullbacks (market down > 5.0%-9.9% = 56/72 = a probability p=78% ... AND ... 21 corrections (market down 10.0%-19.9%) = 21/72 = a probability p=29% ... AND ...12 bear markets (down >20%) for a probability of 12/72 = p=17%. #2 I recommend readers review your AAII article from May 2014, "The Danger of Getting Out of Stocks During Bear Markets," @ https://www.aaii.com/journal/article/the-danger-of-getting-out-of-stocks-during-bear-markets. #3 In 1979, Dan Kahneman proved that most people (around 65% of those tested) use heuristics to interpret probabilities. They tended to "round off" his Prospect Theory S-curve around the center reference point and at both ends, making it kinked into three segments that mirrored their emotions "safe bets - no interest - risky bets." People "flatten" probabilities around the center "reference point" (their status quo), making them demand "steeper" odds to take bets either way. They steepen the curve at both ends, causing them to forego favorable bets that are less than a "sure" 100%, AND seeking unfavorable bets to recover prior losses. Thus, they compress a normally distributed 0%-100% linear curve into extreme behaviors, such as "aversion to losses" and a "preference for gains." #4 These common "heuristics" (rules-of-thumb) should make Stovall's percentages on drawdowns and recoveries, and any percentages generated by the anticipated AAII "soft sentiment + hard data" surveys, interesting.
You need to log in as a registered AAII user before commenting.
Create an account