

The Bond Market Is Adjusting, Not Growling
by Charles Rotblut | May 29, 2025
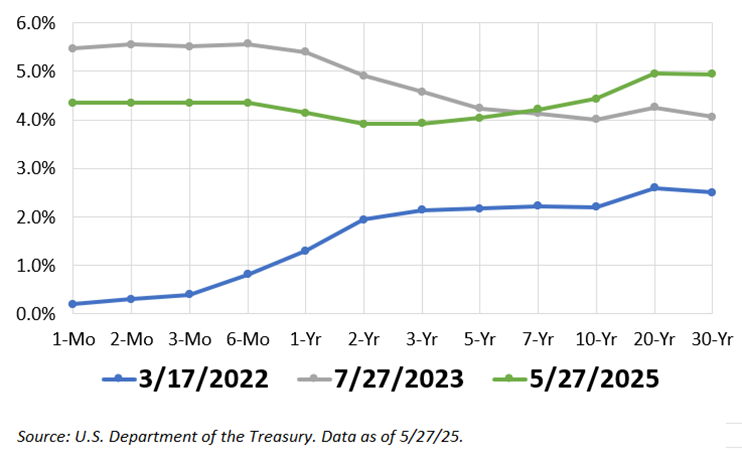
The bond market has been making headlines as of late. Drawing particular attention is the 30-year Treasury bond’s yield. It jumped from a 2025 low of 4.41% on April 4 to 5.08% last week. These were its highest yields since the fall of 2023.
The recent jump in the long bond’s yield has led to “term premium” being increasingly mentioned. The term premium is the extra compensation investors demand for committing funds over a longer period. Investors should expect a term premium since inflation reduces the value of future dollars.
Due to the inverted yield curve (short-term yields higher than long-term yields), term premiums for long-term Treasuries turned into discounts. This has started to change. The rise in rates at the long end of the curve resulted in the 30-year Treasury bond’s yield exceeding the one-year Treasury bill’s yield of 4.14% on Tuesday, May 27.
Treasury Bond Yield Curve
A few factors are being cited for the reemergence of the term premium. One is concerns about rising federal government debt. The tax cuts and extensions included in the One Big Beautiful Bill Act are projected to increase future deficits and, thereby, the national debt. Another factor is fear about the U.S. dollar losing its status as a reserve currency. The U.S. dollar is the least dirty shirt in the closet, with no other currency being a good alternative.
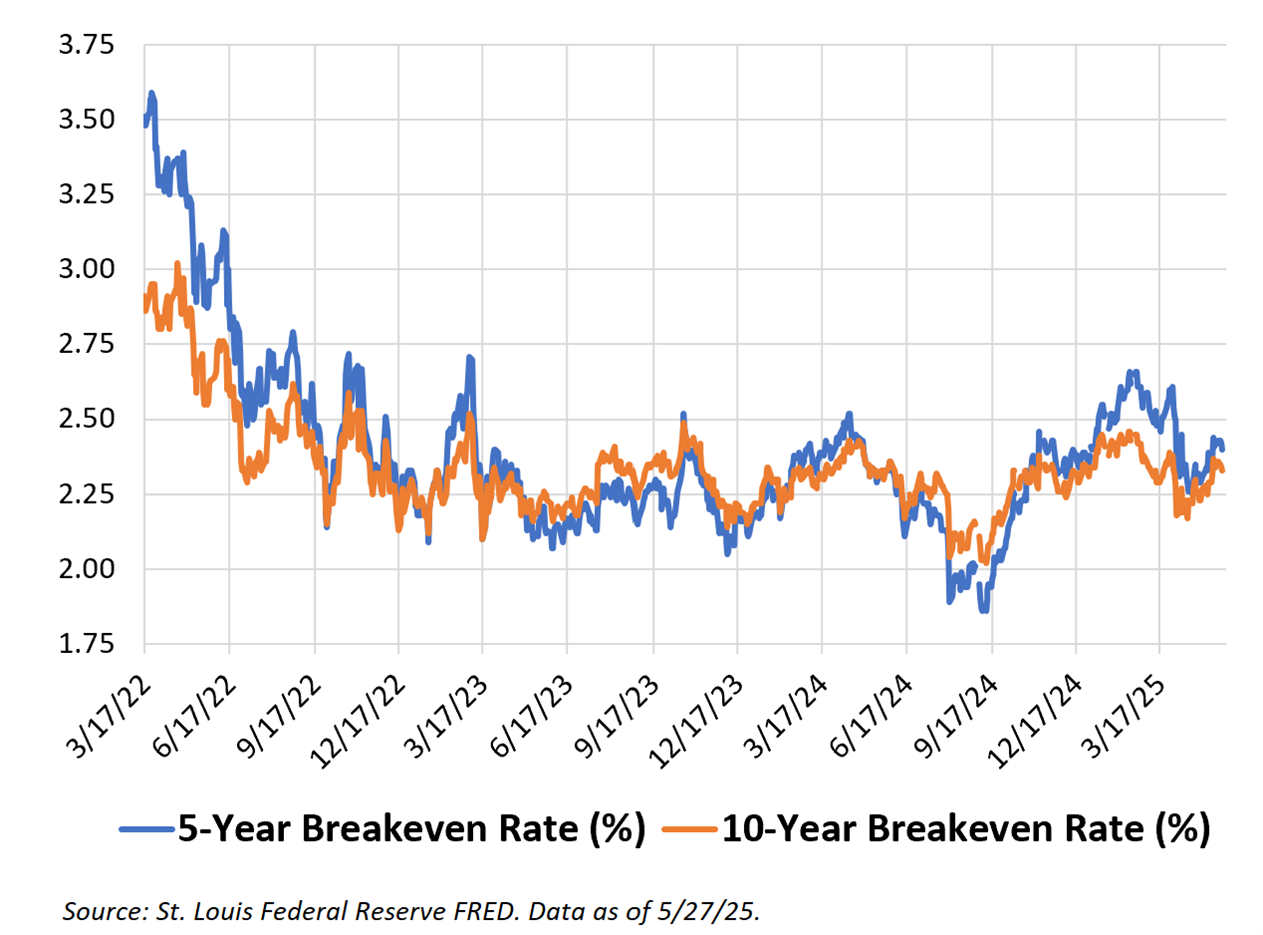
Concerns about future inflation are also being blamed. The bond market has been pricing in higher levels of inflation since last fall. If one steps back and looks at a longer trend, shown in the chart below, breakeven rates are largely within the same trend that began in the fall of 2022.
Breakeven rates signal what bond market participants expect inflation to be in the next five years and the next 10 years. Unlike economic forecasts, these are based on where traders and investors have put their money to work.
The Bond Market’s Inflation Expectations
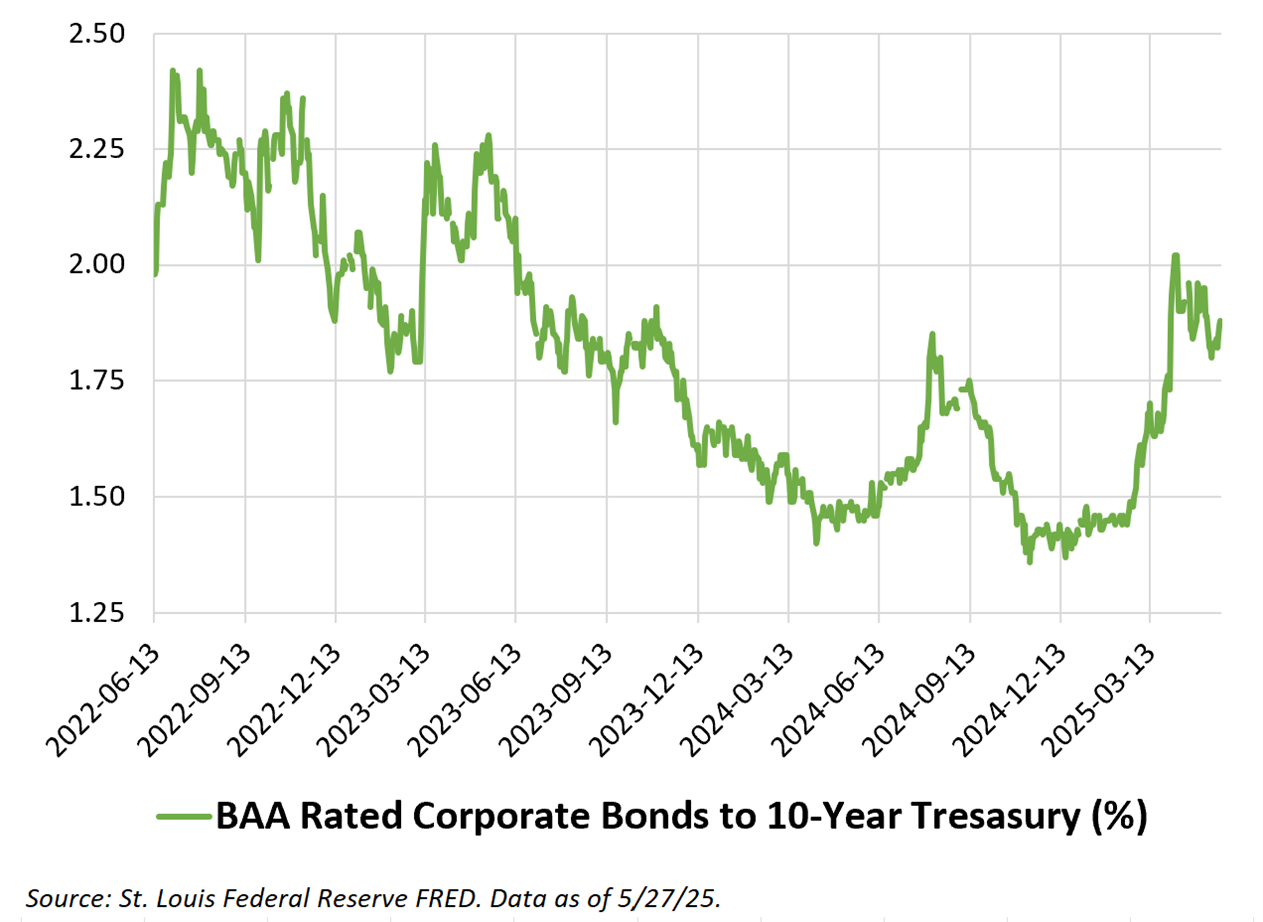
Getting less attention but still notable are credit spreads. Spreads represent the additional yield investors demand from riskier issuers.
Credit scores provide a good analogy. Borrowers with top-tier credit scores of 781 to 850 will pay lower interest rates for an auto loan than those with lower credit scores.
Credit spreads have widened since President Donald Trump called for reciprocal tariffs in mid-February. A broader view shows this is not currently a reason for worry.
The current spread between corporate bonds with the lowest investment-grade credit ratings (Moody’s Baa) and 10-year Treasury bonds is roughly the same as it was two years ago. Furthermore, credit spreads have exceeded 300 basis points (bps), or 3%, several times over the past 25 years. The spread was 188 bps last Friday.
The Spread Between Treasury and Corporate Bond Yields
All three of these indicators imply bond traders have been pricing in a higher level of risk relative to a few months ago. This change appears to be an adjustment, not an alarm bell.
The Smartest Investors Track Something You Can’t See
You follow fundamentals. You study technicals. But what moves the market in the short term? Mood.
The market doesn’t run on logic alone. It runs on emotion — fear, greed, anxiety, overconfidence. These emotional forces can ripple through headlines and trading floors long before price charts reflect the shift.
At AAII, we’ve spent decades studying investor sentiment. Now we’re building a tool to make it visible and usable — so you can make more confident decisions when the crowd gets shaky.
But before we launch, we want your insights:
What’s your biggest challenge when it comes to interpreting investor sentiment?
Is it separating noise from signal? Spotting the turning points? Trusting your instincts?
Help us shape a tool that brings behavioral finance down to earth for real investors.

-
What Is the Yield Curve?
The yield curve of U.S. Treasuries is a beneficial tool for investors in that it may identify major potential changes in the economy ahead of their occurrence. It is also free to the public and easy to use. -
Understanding the Breakeven Inflation Rate
The breakeven inflation rate is a helpful guide for determining minimal rates of return required to maintain wealth in real terms. -
Holistic Yield Investing: Meb Faber’s Unique Screening Approach
The May 2025 AAII Journal highlights stocks that reward shareholders by paying dividends, lowering the number of shares outstanding and reducing debt.
AAII Sentiment Survey
Pessimism among individual investors about the short-term outlook for stocks increased in the latest AAII Sentiment Survey. Meanwhile, optimism and neutral sentiment decreased.
Bullish sentiment, expectations that stock prices will rise over the next six months, decreased 4.8 percentage points to 32.9%. Bullish sentiment is below its historical average of 37.5% for the 16th time in 17 weeks and is above 30% for only the eighth time this year.
Neutral sentiment, expectations that stock prices will stay essentially unchanged over the next six months, decreased 0.3 percentage points to 25.2%. Neutral sentiment is below its historical average of 31.5% for the 45th time in 47 weeks.
Bearish sentiment, expectations that stock prices will fall over the next six months, increased 5.1 percentage points to 41.9%. Bearish sentiment is unusually high and is above its historical average of 31.0% for the 26th time in 28 weeks.
The bull-bear spread (bullish minus bearish sentiment) decreased 10.0 percentage points to –9.0%. The bull-bear spread is below its historical average of 6.5% for the 21st time in 23 weeks.
This week’s special question asked AAII members which factor is most influencing their six-month outlook for stocks.
Here is how they responded:
- Tariffs, the economy, and/or inflation: 63.7%
- Corporate earnings: 10.7%
- Valuations: 10.4%
- Monetary policy/interest rates: 8.9%
- Other: 6.3%
Bullish: 32.9%, down 4.8 points
Neutral: 25.2%, down 0.3 points
Bearish: 41.9%, up 5.1 points
Bullish: 37.5%
Neutral: 31.5%
Bearish: 31.0%
See more Sentiment Survey results.

May 22, 2025 May Charts of Interest: The Impact Tariffs Are Already Having
May 15, 2025 Flat but Furious: The S&P 500's Volatile Start to 2025
May 8, 2025 My Six Key Lessons From Warren Buffett
May 1, 2025 Five Moves to Stay Calm When the Market Isn't

Discussion
vic smyth from illinois posted over 1 year ago:
biggest challenge when it comes to interpreting investor sentiment: spotting turning points, because there never seem to be turning points so it can't really be used as a timing indicator as it can remain overly bullish or overly bearish for extended periods of time. It can give you the temperature of the market, but will never tell you when the fever will break.
You need to log in as a registered AAII user before commenting.
Create an account