

Charts of Interest to Individual Investors
by Charles Rotblut | February 16, 2023
As part of my role, I come across many charts, tables and infographics conveying data about investing, the economy and personal finance. A few make their way into my commentaries but many interesting ones don’t simply because they don’t match the topic I’m writing about.
Rather than letting those charts be buried in my email inbox or my browser history, my intention is to start sharing the insightful ones. When the chart is on a publicly accessible webpage with more context provided, I include the link.
Are We Getting Closer to Disinflation?
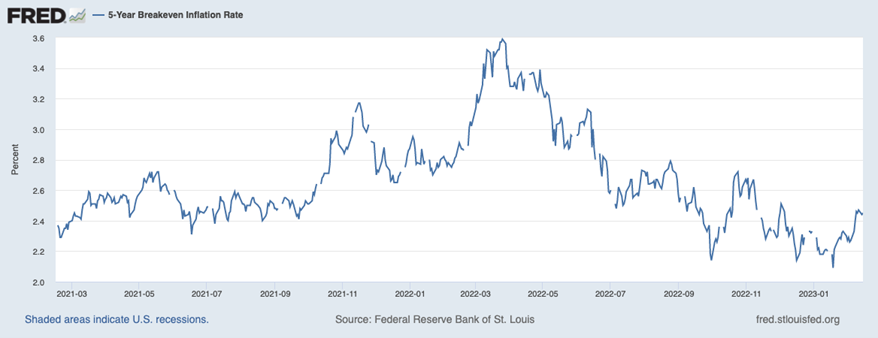
Federal Reserve chairman Jerome Powell is looking for signs of disinflation kicking in. The data is messy, but in general, the bond market has become less fearful about inflation staying at high levels since last summer. The chart below shows that the five-year inflation expectations are priced in by the bond market as of February 14, 2023.
It’s Still Painful to Go to the Grocery Store
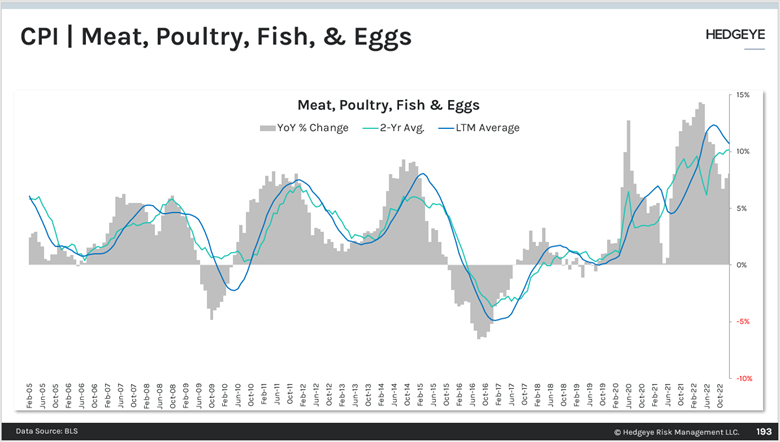
HedgeyeStaples noted that meat, poultry, fish and egg prices continued to rise in December 2022. Egg prices were up 70% on a year-over-year basis and increased 8.5% in January 2023 relative to January 2022. As one bar and grill said on its sign, “the Powerball jackpot is up to 8 dozen eggs.”
Lots of Pessimism, but Pendulum Could Be Swinging Back
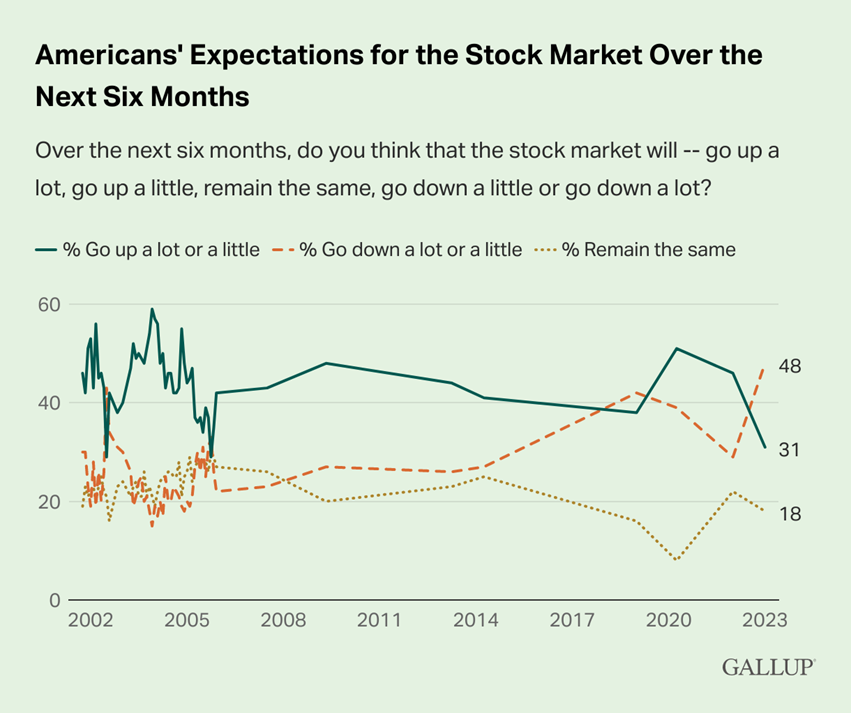
This January survey from Gallup confirms what the AAII Sentiment Survey and others showed over the past several months: More people expect stocks to fall than to rise. Commenting on its findings, Gallup noted, “It is possible Americans would have been even more pessimistic than now about the stock market during the Great Recession and financial crisis, when stocks lost much more value than they did in 2022. Gallup didn’t ask this question during that period but did find in April 2008 that 62%, near the record high, thought it was a bad time to invest in the stock market.”
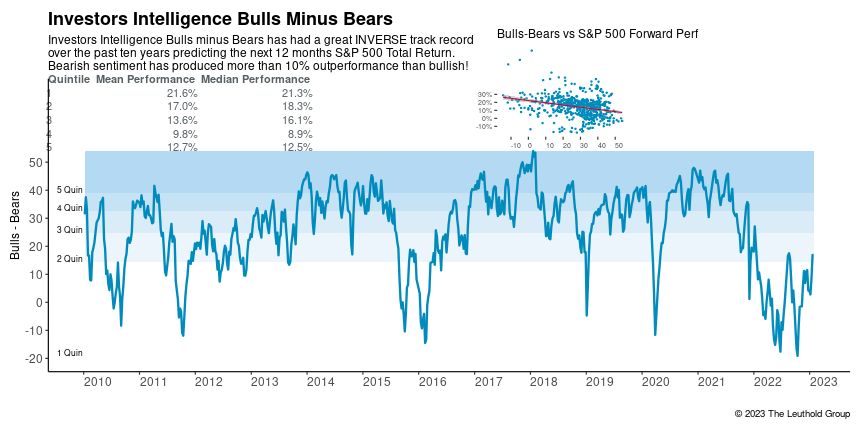
Investment newsletter writers have been cautious too, even though the optimism is starting to improve. The chart below is from the Leuthold Group. Note that, over the last month, the Investors Intelligence survey was still flashing a contrarian signal for the stock market.
Value Remains on Sale
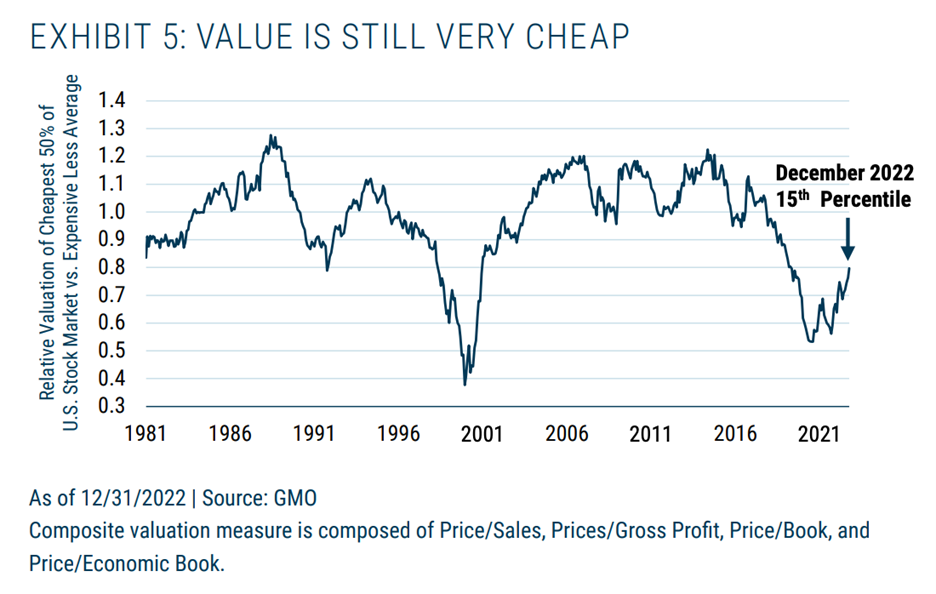
The chart below is from Jeremy Grantham at investment management firm GMO. I’ve seen similar charts from other firms. We at AAII have observed value being cheap as well. The chart compares the valuations of cheap stocks to the valuations of expensive stocks. As you can see at a glance, value remains historically cheap relative to growth.
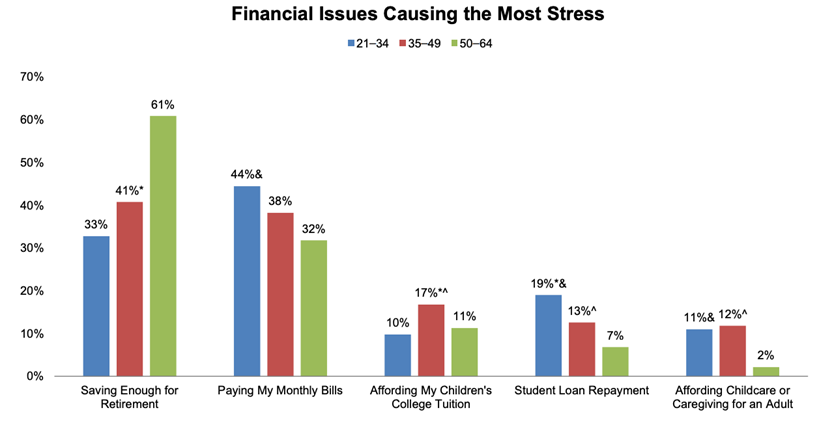
Financial Issues Causing Stress
The financial issues that cause the largest amount of stress vary by age. According to the Employee Benefit Research Institute (EBRI), younger adults fret most about how to pay their monthly bills. For workers age 50 or older, saving enough for retirement is the biggest worry.
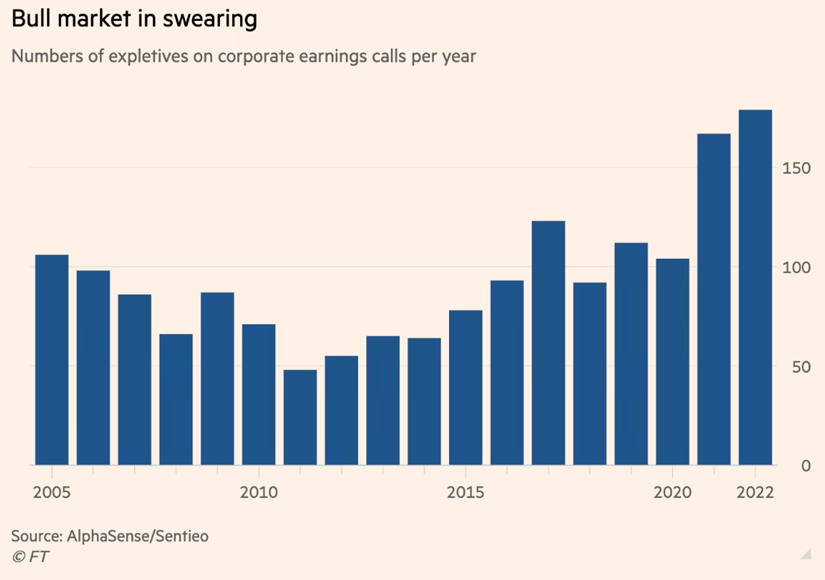
Watch Your Language!
Incidents of swearing on conference calls is on the rise. The Financial Times, which published this chart, attributed the new record use of foul language to a “‘polycrisis’ of runaway inflation, pandemics, interest rate increases, supply chain snafus and wars [that] helped lift swearing on earnings calls.”
Evidently, some corporate executives need to wash their mouths out with soap.

-
It's Been Difficult for the Fed to Pull Off Economic Soft Landings
Most prior rate-hike cycles have been followed by recessions, so-called hard landings. Only one of the 11 previous rate-tightening cycles has resulted in a perfect soft landing. -
What You Can Gain From Reading the Economic Tea Leaves
Comparing changes in given metrics and their relative performance allows us to assess if economic activity is accelerating or decelerating and adjust our portfolio allocations if desired. -
Tips for Choosing the Right Funds for Your Needs
Simple guidelines for deciding which funds are right for you. Plus, AAII’s tools and resources that can make your decision a cinch. -
Dividends Help Investors Maintain Their Standard of Living
Investors who rely on their investments to maintain their standard of living throughout their retirement years often create “homemade dividends” by periodically selling shares. -
Pros and Cons of Owning Property
In her latest My Investing Discoveries blog post, Anine Sus looks into the issues involved in buying a house to see whether property ownership might be in her future.
AAII Sentiment Survey
Neutral sentiment declined but still extended its streak of above-average readings in the latest AAII Sentiment Survey. Bullish sentiment also decreased, while bearish sentiment rose.
Bullish sentiment, expectations that stock prices will rise over the next six months, pulled back by 3.4 percentage points to 34.1%. Optimism is back below its historical average of 37.5% after being at the average last week for the first time in 58 weeks.
Neutral sentiment, expectations that stock prices will stay essentially unchanged over the next six months, declined 0.4 percentage points to 37.1%. Neutral sentiment is above its historical average of 31.5% for the seventh consecutive week. This is the longest streak of above-average neutral sentiment since a seven-week stretch in December 2021 and January 2022.
Bearish sentiment, expectations that stock prices will fall over the next six months, rebounded 3.8 percentage points to 28.8%. Pessimism is below its historical average of 31.0% for just the fifth time out of the past 65 weeks. Bearish sentiment is also below average on consecutive weeks for the first time since a five-week stretch in October and November 2021.
The bull-bear spread (bullish minus bearish sentiment) is 5.3%. This is the first time optimism has exceeded pessimism on consecutive weeks since November 2021.
This year’s rebound in stock prices along with less aggressive monetary policy are likely contributing to the improved level of optimism. Nonetheless, concerns about the economy, inflation and corporate earnings remain.
Bullish: 34.1%, down 3.4 points
Neutral: 37.1%, down 0.4 points
Bearish: 28.8%, up 3.8 points
Bullish: 37.5%
Neutral: 31.5%
Bearish: 31.0%
See more Sentiment Survey results.

February 9, 2023 Recent Dividend Aristocrats Additions Reveal Leeway in the Rules
February 2, 2023 We Want Your Feedback on an AAII Journal Article Idea
January 26, 2023 Two Ways to Select a Stock From a Screen
January 19, 2023 Closed-End Muni Bond Funds Are Cutting Their Payouts

Discussion
No comments have been added yet. Add your thoughts to the discussion!
You need to log in as a registered AAII user before commenting.
Create an account