

Both Small-Cap and Large-Cap Stocks Rebound Strongly
by Charles Rotblut | March 09, 2023
Last weekend, a friend of mine expressed concern about his adviser’s desire to maintain an allocation to small-cap stocks. My friend cited the performance of the large-cap S&P 500 index relative to small-cap stocks as the reason for not needing small-cap exposure. I responded by explaining that a period of 10 to 12 years is too short make a judgment.
As irony would have it, a couple of days later, I received commentary arguing in favor of small-cap stocks from Gregg Fisher of Quent Capital. Fisher essentially described the outperformance of large-cap stocks relative to small-cap stocks over the past 11 years as being unusual. He further said the ending of low interest rates removes a catalyst that previously supported high valuations for high-growth stocks.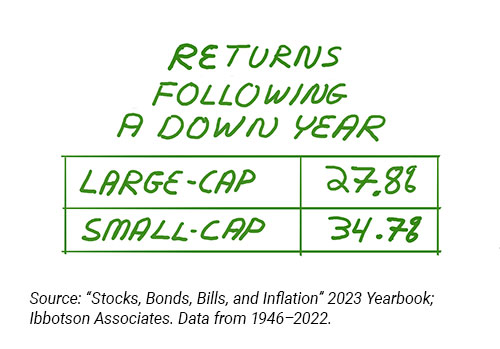
Who is right? Well, the data supports having an allocation to both large-cap and small-cap stocks—including now, even though we remain in the midst of a bear market.
My buddy was correct in saying large-company stocks have outperformed in more recent times. During the 10-year period ending December 2022, large-cap stocks returned a sizzling 16.1% on an annualized basis versus a still impressive 14.9% for small-company stocks. To have enjoyed these great returns, investors would have had to stay consistently allocated to stocks—a point that is too often overlooked.
Over the long term, the returns are still very good. Between 1946 and 2022, large-company stocks realized an annualized return of 10.9% according to data from the Ibbotson “Stocks, Bonds, Bills, and Inflation” 2023 Yearbook. Small-company stocks gained a more impressive 12.4%. While very few have 77-year-old portfolios, these annualized gains show that stocks have gained despite wars, recessions, financial crises, a pandemic and all sorts of political drama.
Resiliency is another a very big reason for staying allocated to stocks. Fisher also cited this as a reason in making the case for small-cap stocks. Since World War II, down years for small-company stocks were followed by gains nearly three-quarters of the time (73%). The average return during those rebound years was 34.7%; the median return was 25.2%.
What about large-company stocks? I’m glad you asked because the numbers—to paraphrase comedian Larry David—are pretty, pretty good. Large-company stocks rebounded 69% of the time following a down year. The average rebound during those up calendar years that followed a down year was 27.8%; the median return was 27.6%.
I know you’re probably thinking: “Whoa! Those are big numbers!” It’s easy to forget how much upside volatility the stock market can have when we’re mired in a bear market.
Some of you are probably taking the opposite stance and want to know what happened during those preceding bad years. The losses are smaller than you might expect. Since World War II, the average calendar-year loss for small-company stocks has been 12.4%. The median loss has been 10.4%. Large-company stocks have fared slightly better on this metric, with an average calendar-year loss of 11.7% and a median loss of 8.9%. (These numbers exclude 2022. With 2022 included, the average losses are 12.1% and 12.4% for large-cap and small-cap stocks, respectively.)
If those losses are smaller than you expected, there are two things to keep in mind. First, bear markets are not confined to calendar years. Large-company stocks ended 2007 up 5% even though the financial crisis started and worsened during the year’s second half. Second, though long and severe bear markets stand out in memory, large-company stocks have only experienced back-to-back down calendar years twice since World War II (1973–1974 and 2000–2022). Small-company stocks have only done so three times (1969–1970, 1973–1974 and 2007–2008).
Looking at market history helps to establish expectations for what could happen in the future. While history never guarantees what will happen—there is always the risk of a few big things going wrong, or right—it is frequently a better gauge to rely on than the shorter-term themes and forecasts made by so-called soothsayers who rely on their cracked crystal balls.

-
Pains and Gains From Small-Cap Value Stocks
Combining small-cap value and the S&P 500 can provide higher returns and a less painful ride over the long term. -
Index Fund Options for AAII’s Asset Allocation Models
We use Vanguard funds for tracking purposes, but they are not the only option when using the allocation models as a guideline for your own portfolio. -
The Truth About Annuities and Inflation
While there is no annuity strategy that perfectly solves for inflation, specific types of annuities can lessen its sting. -
All-Stars: Stocks That Pass Multiple Screens
Looking at stocks that pass multiple screening approaches can be valuable if the approaches are based upon solid financial principles and are diverse enough to capture unique yet desirable qualities. -
Split on Growth and Value Strategies? Investors Weigh In
In the AAII Community, we have set up special interest groups for Value Investing and Growth Investing.
Members are looking for your input. Can you help with this question from the Technical Analysis Community?
“I have been studying momentum-based sector rotation strategies. It’s based on buying the three top-performing S&P sectors once a month … For a bear market indicator I use a death cross/golden cross indicator combined with the triple exponential average (TRIX) indicator. Does anybody else have similar observations?”
Tap the button and then choose the Join the Community button on the right to answer this question in the AAII Community
Answer This Question in the AAII Community »
AAII Sentiment Survey
Neutral sentiment rose, extending its streak of above-average readings to 10 consecutive weeks in the latest AAII Sentiment Survey. Bearish sentiment fell but remained unusually high, while bullish sentiment rose but remained unusually low. In addition, the majority of surveyed AAII members said fourth-quarter earnings approximately matched their expectations.
Bullish sentiment, expectations that stock prices will rise over the next six months, increased 1.4 percentage points to 24.8%. Optimism is at an unusually low level for the third consecutive week and the 43rd time out of the past 62 weeks. Bullish sentiment is also below its historical average of 37.5% for the 66th time out of the past 68 weeks.
Neutral sentiment, expectations that stock prices will stay essentially unchanged over the next six months, increased by 1.6 percentage points to 33.4%. At 10 consecutive weeks, this is the longest stretch of above-average readings since a 22-week stretch between August 2019 and January 2020. The historical average for neutral sentiment is 31.5%.
Bearish sentiment, expectations that stock prices will fall over the next six months, decreased 3.1 percentage points to 41.7%. Pessimism is at an unusually high level for the second consecutive week and the 41st time out of the past 62 weeks. Bearish sentiment is also above its historical average of 31.0% for the 63rd time out of the past 68 weeks.
The bull-bear spread (bullish minus bearish sentiment) increased by 4.5 percentage points to –16.9% but remains unusually low for the third consecutive week. The bull-bear spread is at an unusually low level for the 45th time out of the past 62 weeks.
Historically, the S&P 500 index has gone on to realize above-average and above-median returns during the six- and 12-month periods following unusually low readings for bullish sentiment and the bull-bear spread. Similarly, the market benchmark has gone on to realize above-average and above-median returns during the six- and 12-month periods following unusually high readings for bearish sentiment.
Monetary policy, interest rates, inflation and the pace of economic growth are all influencing individual investors’ short-term outlook for stocks.
This week’s special question asked AAII members how they perceived fourth-quarter earnings. Here are their responses:
- Earnings were better than I expected: 29.9%
- Earnings approximately matched my expectations: 7%
- Earnings were worse than I expected: 8.7%
Bullish: 24.8%, up 1.5 points
Neutral: 33.4%, up 1.6 points
Bearish: 41.7%, down 3.1 points
Bullish: 37.5%
Neutral: 31.5%
Bearish: 31.0%
See more Sentiment Survey results.

March 2, 2023 Buffett on Buybacks, Dividends and Investing Mistakes
February 23, 2023 Portfolios With the Lowest-Cost Mutual Funds and ETFs
February 16, 2023 Charts of Interest to Individual Investors
February 9, 2023 Recent Dividend Aristocrats Additions Reveal Leeway in the Rules

Discussion
vic from illinois posted over 3 years ago:
I believe that there is a typo in the second to the last paragraph of your article: "2000–2022". Should be "2000-2002"?
Barry from TX posted over 3 years ago:
Thank you, Charles, for taking the time to compile all these data points. I’ll meet you and Gregg at the Rivers Casino. I think we can get better odds there than the ones touted here to stay “all in” in the 2033 bear market. The long-term (77 years) odds you are offering for the 2023 market are small-caps losing 12.4% (10 of 77 years) with a median loss of 12.4% ... or large-caps losing 11.7% (or 9 or 77 years) and a median loss of 8.9%. 2023 is looking a lot like it could be year #10 or year #11. If someone has $100,000 invested with those odds, the downside is 50%/50% odds of losing $11,700 to $12,400. A 1 million portfolio loses $117K or $124K. How long will it take to recover those amounts? A long-term average ROI of 6% means about two GOOD years. What are the odds of rolling 7 or 11 two times in a row? If I resist these temptations and can avoid those losses with a 4% gain or so with bonds or money market funds. That’s a differential of around 15%. A 50/50 portfolio will at least cut the losses in half. With those odds, we don’t need any “professional financial advisors” who stand to make 2.5% + 20% in fees even when we lose. Please don’t bring Gregg to the casino. He might ask to borrow my money to place his bets. I may be a no-show at the craps table. Dan Kahneman says our “experiencing self” experiences greater pain from losses than happiness from gains. I like Dan’s odds better than Gregg’s. I pass the dice this time. If I want to lose a bet, I'll check the odds on the Dallas Cowboys winning a Super Bowl in the next 77 years (by 2100).
Barry from TX posted over 3 years ago:
Every time I review the AAII Sentiment data, I feel like I am several French fries short of getting the Happy Meal I expected. The numbers bounce around, but nothing changes ... and these are data are being collected during VERY volatile times. The markets go up or down 1-3% every DAY ... and 5% a WEEK. Yet the sentiment percentages expectations for total change over the next 6 MONTHS maintain a consistent rolling 1-3% allocation. Using the Friday SPX ending total (3,861.59), that means the range of change expected in 6 months is between UP 54 points (1.4% Bulls) to DOWN 199 (3.1% Bears), a 153 point 4.5% spread during 75% (historical average) of the weeks last 5 years. These augers well for taking a longer-term investment perspective. However, these data also report that the relative categorizations of the sentiment choices are unchanged 36% of the time (Bulls) and 66% (Bears) over 5+ years. In "Self-Reliance" (1841), Emerson observed, " A foolish consistency is the hobgoblin of little minds ... a great soul has simply nothing to do. He may as well concern himself with his shadow on the wall." Since AAII is The Temple Cloonan of long-term investment thinking, would it be UNFAIR to characterize these data as being dominated by "true believers" and therefore a biased, not a random, sample?
You need to log in as a registered AAII user before commenting.
Create an account