

Many of This Year's New ETFs Are Speculative or Complex
by Charles Rotblut | July 30, 2026
Featured Tickers: ACYN
AMAA
ANV
BAIV
DFAL
DJP
NVDA
XCOM
XQQI
ACYN
AMAA
ANV
BAIV
DFAL
DJP
NVDA
XCOM
XQQI
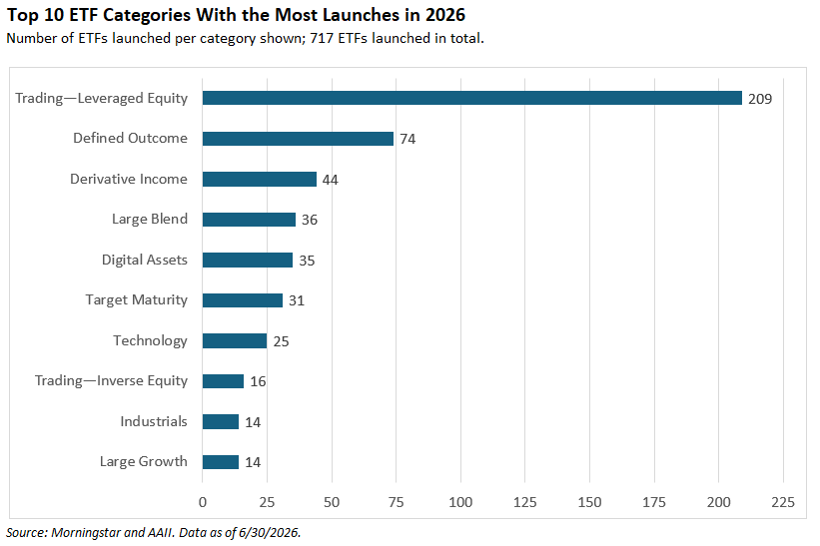
Two words describe the largest types of exchange-traded funds (ETFs) launched during the first half of this year: speculative and complex. Speculative refers to the 232 leveraged ETFs brought to market between January and June 2026. They account for nearly one-third of this year’s new ETFs. Complex refers to the 44 ETFs that use options-based strategies to create a stream of income.
These products are not suitable for most individual investors. I explain why below.
Leverage ETFs Seek to Tap Into a Short-Term Mentality
Corgi Funds was the single biggest issuer during the first half of 2026. It launched 148 ETFs; 60% of them are leveraged.
Those leveraged ETFs seek to provide 2x the daily return of an underlying benchmark for a single day. Holding those ETFs beyond a single day will result in returns that differ from the performance of the underlying stock. This is because leverage amplifies the effect of volatility.
Many of them are single-stock ETFs, such as Corgi AMZN 2x Daily ETF  (AMAA). Other Corgi Funds leveraged ETFs track a sector or asset class, such as Corgi All Commodities 2x Daily ETF (XCOM). This ETF tracks iPath Bloomberg Commodity Index Total Return ETN (DJP). Adding leverage to an already volatile security is a recipe for blowing a hole in your portfolio.
Corgi Funds is not the only provider launching new 2x ETFs. A total of 230 ETFs with “2x” in their name came to the market this year. There are also two 3x ETFs that launched between January and June 2026. Most have not attracted significant assets, as investors have preferred to sniff elsewhere.
Using Derivatives to Create a Stream of Income
The derivative income category ranks third in terms of how many new ETFs (44) were launched this year, behind the defined outcome category (74). The defined outcome category is primarily composed of buffer ETFs. These ETFs limit downside risk while capping upside potential.
Derivative income ETFs are more complex.
Some, like NEOS Boosted Nasdaq-100 High Income ETF (XQQI), create income by overlaying options on top of stock holdings. NEOS Boosted Nasdaq-100 High Income replicates the performance of the Nasdaq 100 index by managing a portfolio of stocks. It then boosts its exposure by buying index call options and selling index put options at generally similar strike prices. The cash generated from these options positions is then passed on to the ETF’s shareholders via monthly distributions.
Others, like FT Vest Laddered Autocallable Barrier & Income ETF (ACYN), go further by using derivatives not only to create income but also to provide downside protection. Specifically, they use synthetic autocallable contracts (“autocallables”).
Autocallables are linked to a benchmark. FT Vest Laddered Autocallable Barrier & Income lists one or more broad-based U.S. equity indexes (e.g., the S&P 500 index, the Russell 2000 index and/or the Nasdaq 100) or index ETFs as its benchmarks. The returns of the benchmarks determine whether income payments are made, if the autocallable is called prior to its maturity or if losses may be incurred at maturity. The autocallable is called when the worst-performing reference asset is at or above its initial value on a preset date. If the worst-performing reference is below a preset amount (known as the maturity barrier), a loss is realized and a new autocallable is purchased. First Trust provides a longer explanation in the ETF’s fact sheet.
GraniteShares goes a step further with its single-stock autocallable ETFs. GraniteShares Autocallable NVDA ETF (ANV), for instance, uses Nvidia Corp. (NVDA) as its reference asset.
If you have a hard time understanding how synthetic autocallable contracts work, then these ETFs are not for you. The complexities of these ETFs make them products intended to be sold, not bought.
Some Mainstream ETFs Have Launched This Year
The dominance of the largest index ETFs has forced most new ETF sponsors to focus on niche themes and strategies to attract assets. Still, there are some exceptions for investors who prefer more traditional strategies in an ETF format.
Here are two of the larger such ETFs to have launched this year:
-
Dimensional US Large Cap Core Equity Market ETF (DFAL) began trading in June. This low-cost ETF attempts to avoid what Dimensional Fund Advisors describes as the “potential inefficiencies of indexing.”
-
Brown Advisory International Value Select ETF (BAIV) is an actively managed ETF that uses a fundamental approach in targeting foreign stocks. It was launched in February.
I always prefer simpler, low-cost investment options to more complex ones. When in doubt, stick with what you know.

-
Leveraged ETFs: Don’t Get Wiped Out by the Tail
Think carefully before buying a leveraged investment product that might seem highly attractive based on historical performance. Two key negatives are volatility drag and tail risk. -
Customizing Your Large-Cap Allocation With ETFs and Mutual Funds
An examination of the ETF and mutual fund options that can fill the large-cap domestic equity portion of a portfolio. -
Key Characteristics of the Most Common Investment Scams
In the July 2026 AAII Journal, FINRA’s Christine Kieffer explains how to identify a financial scam to help you keep your money and your personal information safe.
AAII Sentiment Survey
Optimism among individual investors about the short-term outlook for stocks increased in the latest AAII Sentiment Survey. Meanwhile, neutral sentiment and pessimism decreased.
Bullish sentiment, expectations that stock prices will rise over the next six months, increased 1.4 percentage points to 31.0%. Bullish sentiment is below its historical average of 37.5% for the fourth time in five weeks.
Neutral sentiment, expectations that stock prices will stay essentially unchanged over the next six months, decreased 1.2 percentage points to 26.9%. Neutral sentiment is below its historical average of 31.5% for the 106th time in 108 weeks.
Bearish sentiment, expectations that stock prices will fall over the next six months, decreased 0.2 percentage points to 42.1%. Bearish sentiment is unusually high and is above its historical average of 31.0% for the 25th consecutive week.
The bull-bear spread (bullish minus bearish sentiment) increased 1.6 percentage points to –11.1%. The bull-bear spread is below its historical average of 6.5% for the fourth time in five weeks.
This week’s special question asked AAII members what their opinion is of new Federal Reserve chair Kevin Warsh.
Here is how they responded:
- I want to give him more time before voicing an opinion: 58.5%
- He is a good pick to head the Fed: 22.6%
- I would have preferred that someone else be the Fed chair: 13.3%
- Not sure/no opinion: 5.6%
Bullish: 31.0%, up 1.4 points
Neutral: 26.9%, down 1.2 points
Bearish: 42.1%, down 0.2 points
Bullish: 37.5%
Neutral: 31.0%
Bearish: 31.5%
See more Sentiment Survey results.

July 23, 2026 July Charts of Interest: The Widespread Influence of AI Spending
July 16, 2026 How to Build an Earnings Season Watchlist
July 9, 2026 Extreme Accounting Numbers Deserve a Closer Look
July 2, 2026 The Stock Market at Midyear: Big Gains Fueled by Earnings Growth

Discussion
No comments have been added yet. Add your thoughts to the discussion!
You need to log in as a registered AAII user before commenting.
Create an account