

Widening Operating Margins Are Boosting Earnings, for Now
by Charles Rotblut | August 06, 2026
Second-quarter 2026 earnings season has been a good one so far. With reports in for more than three-quarters of the S&P 500 index companies, the LSEG I/B/E/S blended estimate shows second-quarter 2026 earnings growing 49.6% year over year. Revenues are up 15.1%. (Both are blended growth rates, which include reported and estimated numbers.)
In between those two numbers are expanding profit margins. Michael Walker of investment firm AllianceBernstein said in recent note that “profit margins are fueling more than half of [this year’s] earnings growth.” According to Walker’s analysis, widening operating margins account for more than half of this year’s projected 24.0% growth in S&P 500 earnings (as of June 30, 2026). Below is his breakdown of earnings growth contributors.
- Revenue growth: 9.6 percentage points
- Operating margin expansion: 13.5 percentage points
- Taxes, interest, buybacks and other: 0.9 percentage points
Walker’s numbers appear to use market-capitalization-weighted estimates. This matters because the largest companies have the biggest influence in a market-cap weighted index. Notably, switching to equal weighting does not materially change the margin expansion story, as you can see in the chart below.
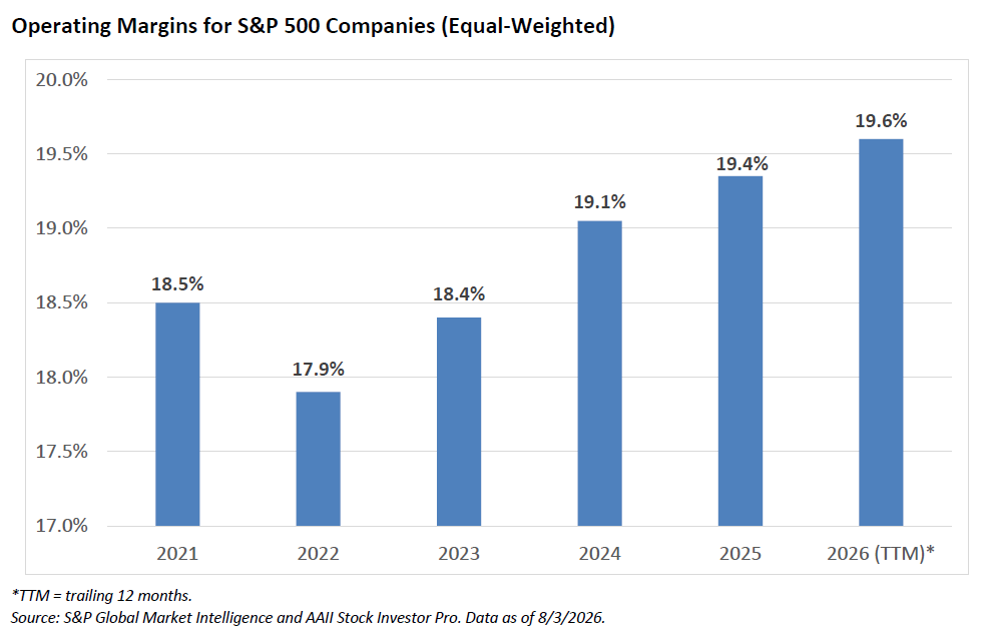
No single sector within the S&P 500 has continuously increased its operating margins since 2021—not even information technology. Several have both enjoyed rising margins for three consecutive years and have higher operating margins on a trailing 12-month basis. It is this breadth that is leading to the S&P 500’s overall wider margins.
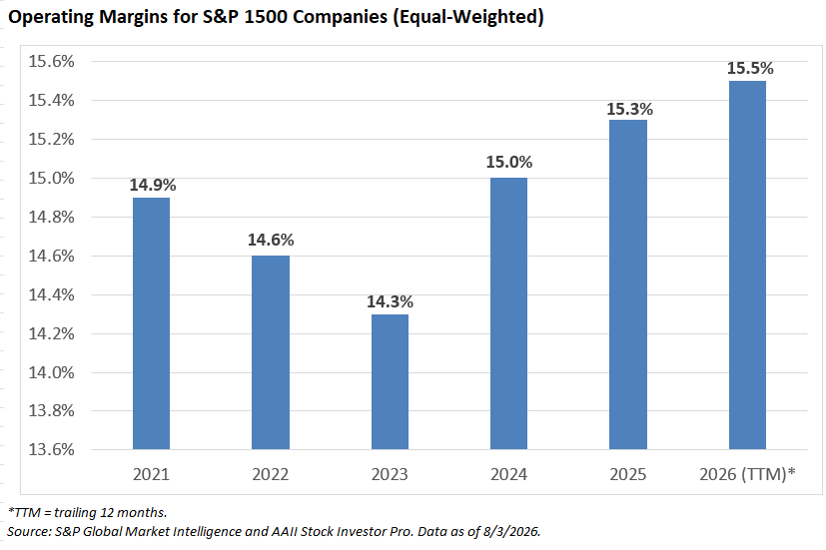
We ran the same analysis on the broader S&P Composite 1500 index. This index combines the S&P 500, the S&P MidCap 400 index and the S&P SmallCap 600 index. The current streak of rising operating margins started one year later than it did for the S&P 500.
Widening Margins Are Good, But …
Wider profit margins occur when a company earns more on each dollar of revenue it receives. As shareholders, we want profit margins to increase in a sustainable way relative to the cyclicality of the business we are investing in.
However, margins can only go so high. Companies have costs beyond raw materials, such as marketing, staffing and other operational costs. There is a limit to how much these costs can be cut. As companies approach that limit, additional streamlining produces diminishing gains. Even gains from tax cuts—which tend to show up more in net margins than operating margins—do not lead to sustained margin expansion.
Ultimately, companies need revenue growth to increase earnings. The ideal company is one that can grow revenues at a good pace while sustaining wide margins relative to its industry or sector peers. Such a good mix is difficult to sustain because wide margins attract competitors who are willing to accept lower levels of profitability in order to gain market share.
This is a point Walker makes. The peak operating profit margins realized in the late 1990s, 2007 and 2018 “preceded stretches of earnings disappointment. Each time, conventional wisdom assumed that a structural change had created a permanently higher margin plateau, yet gravity eventually reasserted itself.”
We could argue about the inclusion of 2007 in Walker’s commentary, but the broader point is valid: Sustainable earnings growth requires more than just rising margins. This is why investors should spend a little time each quarter determining the key drivers behind the company’s revenues and what the company itself is doing to increase revenues in a profitable manner.

-
18 Financial Ratios That Shed Light on a Company’s Strengths and Weaknesses
Financial ratios, such as operating and profit margins, provide a powerful framework for assessing a company’s performance, efficiency and financial health across multiple dimensions and over time. -
The Strength Behind Secular Growth Investing
Unlike cyclical stocks, secular growers can sustain high growth rates for surprisingly long periods. -
Customizing Your Mid-Cap Allocation With ETFs and Mutual Funds
The just-released August 2026 AAII Journal includes an examination of the ETF and mutual fund options that can fill the mid-cap domestic equity portion of a portfolio.
AAII Sentiment Survey
Optimism among individual investors about the short-term outlook for stocks increased in the latest AAII Sentiment Survey. Meanwhile, neutral sentiment and pessimism decreased.
Bullish sentiment, expectations that stock prices will rise over the next six months, increased 6.0 percentage points to 37.0%. Bullish sentiment is below its historical average of 37.5% for the third time in fourth weeks.
Neutral sentiment, expectations that stock prices will stay essentially unchanged over the next six months, decreased 1.9 percentage points to 25.0%. Neutral sentiment is below its historical average of 31.0% for the 22nd time in 23 weeks.
Bearish sentiment, expectations that stock prices will fall over the next six months, decreased 4.2 percentage points to 38.0%. Bearish sentiment is above its historical average of 31.5% for the 26th consecutive week.
The bull-bear spread (bullish minus bearish sentiment) increased 10.2 percentage points to –0.9%. The bull-bear spread is below its historical average of 6.5% for the third time in four weeks.
This week’s special question asked AAII members what they think about the Federal Reserve’s decision to keep interest rates unchanged.
Here is how they responded:
- They should have raised rates: 30.6%
- It was the right move: 55.1%
- They should have cut rates: 5.6%
- Not sure/no opinion: 8.7%
Bullish: 37.0%, up 6.0 points
Neutral: 25.0%, down 1.9 points
Bearish: 38.0%, down 4.2 points
Bullish: 37.5%
Neutral: 31.0%
Bearish: 31.5%
See more Sentiment Survey results.

AAII Asset Allocation Survey
Individual investors’ allocations to bonds increased while stock and cash allocations decreased in the July AAII Asset Allocation Survey.
Stock and stock fund allocations decreased 0.6 percentage points to 70.4%. Stock and stock fund allocations are above their historical average of 61.5% for the 74th consecutive month.
Bond and bond fund allocations increased 1.0 percentage points to 15.4%. Bond and bond fund allocations are below their historical average of 16.0% for the ninth time in 10 months.
Cash allocations decreased 0.4 percentage points to 14.2%. Cash allocations are below their historical average of 22.5% for the 44th consecutive month.
- Stocks and Stock Funds: 70.4%, down 0.6 percentage points
- Bonds and Bond Funds: 15.4%, up 1.0 percentage points
- Cash: 14.2%, down 0.4 percentage points
- Stocks: 30.6%, down 0.3 percentage points
- Stocks Funds: 39.8%, down 0.4 percentage points
- Bonds: 4.4%, up 0.9 percentage points
- Bond Funds: 11.0%, up 0.2 percentage points
- Stocks/Stock Funds: 62.0%
- Bonds/Bond Funds: 16.0%
- Cash: 22.0%
Take the Asset Allocation Survey.
July 30, 2026 Many of This Year's New ETFs Are Speculative or Complex
July 23, 2026 July Charts of Interest: The Widespread Influence of AI Spending
July 16, 2026 How to Build an Earnings Season Watchlist
July 9, 2026 Extreme Accounting Numbers Deserve a Closer Look

Discussion
Barry from TX posted about 1 month ago:
Charles, thanks for using this opportunity to reinforce our knowledge gained through prior AAII educational materials. #1 How a GROWTH STREAM “FLOWS” from SALES GRO to A/R GRO to REV GRO to MARGINS GRO to PROFIT GRO less TAXES/INT & BB to TOTAL RETURNS and then to EPS, the main statistic markets track to compare QOQ GRO and YOY GRO … and … for #2 the related article “18 FINL Ratios That Shed Light on +s/-s,” the ratios that provide a powerful FW for assessing performance, efficiency, and financial health across these multiple dimensions over time. #3 “Traditional P/E ratios miss this dynamic because they focus on comparing only two data points to analyze FCF generation capability, REV GRO persistence and predictability, MKT SH gains, and ROIC.”
Barry from TX posted about 1 month ago:
The Operating Margin data in the bar charts for SPX500 and SPX1500 are interesting for several reasons. #1 In both charts, Op Margins "jumped" above 15% (SPX1500) and 18% (SPX500) after 2023. #2 After 2023, the DIFFERENCE in Op Margins between SPX500 and SPX1500 flattened at 4.1% from 2023 to 2026 although the base rates for both indexes continued to grow as noted in observation #1. #3 This seems to contradict Walker's commentary about Op Margin growth rates... and I get suspicious when I see flat rates of increase. Charles, can you throw me a life preserver?
You need to log in as a registered AAII user before commenting.
Create an account