


Related

Portfolio Strategies
An examination of the ETF and mutual fund options that can fill the mid-cap domestic equity portion of a portfolio.

Charles Rotblut leads a class in AAII's new Essential Investing Video Course. Go to https://www.aaii.com/ves for more information and to subscribe.
Mid-cap stocks are a frequently overlooked part of the stock market. As a targeted asset allocation category, they receive less attention from both investors and academic researchers than large- and small-cap stocks.
Historical returns show that mid-caps deserve attention. According to S&P Dow Jones Indices, the S&P MidCap 400 index realized an 11.5% annualized return between 1995 and March 2025. This is better than the annualized returns of both the S&P 500 index (10.7%) and the S&P SmallCap 600 index (10.3%) over the same period. During the first six months of 2026, the S&P MidCap 400 rose 17.3%.
Mid-cap stocks have had a prominent spot in all three AAII Asset Allocation Models (aggressive, moderate and conservative) since the models were first established. This month, we take a closer look at the exchange-traded fund (ETF) and mutual fund options you can use to fill the mid-cap domestic equity portion of your portfolio.
This article is part of our ongoing series about building a personalized portfolio based on AAII’s allocation models. These models offer sample portfolio mixes designed around an investor’s time horizon and tolerance for short-term market swings. Each model combines stocks, bonds and cash to create a diversified allocation strategy, with fixed-income exposure increasing as an investor’s time horizon shortens or risk tolerance becomes more conservative.
Mid-cap stocks tend to be more established companies, though many may not have the lengthy business histories of large-cap stocks. The median market capitalizations for the S&P MidCap 400 and the Russell Midcap index were $8.1 billion and $13.4 billion, respectively, at the end of June 2026.
Mid-cap stocks are not fully correlated with either large- or small-cap stocks—a characteristic that S&P Dow Jones Indices highlights when describing the segment. Close to two-thirds of S&P MidCap 400 constituents pay dividends.
Sector diversification is much better among mid-cap indexes than it is among large-cap indexes. Four sectors have weightings of at least 10% in both the S&P and Russell mid-cap indexes: industrials, information technology, financials and consumer discretionary. In contrast, the information technology sector accounts for 38.0% of the S&P 500, followed by the financials sector with an 11.8% weighting.
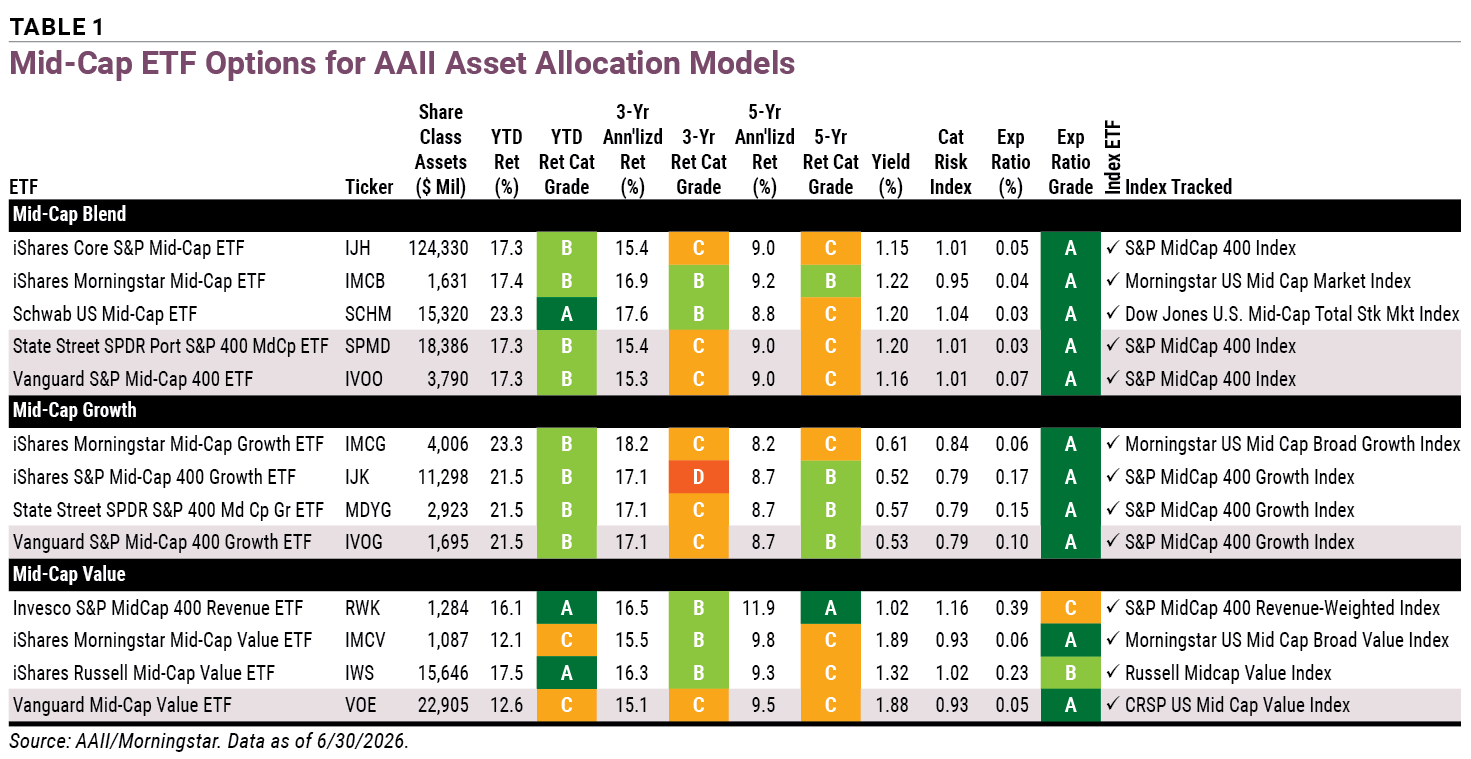
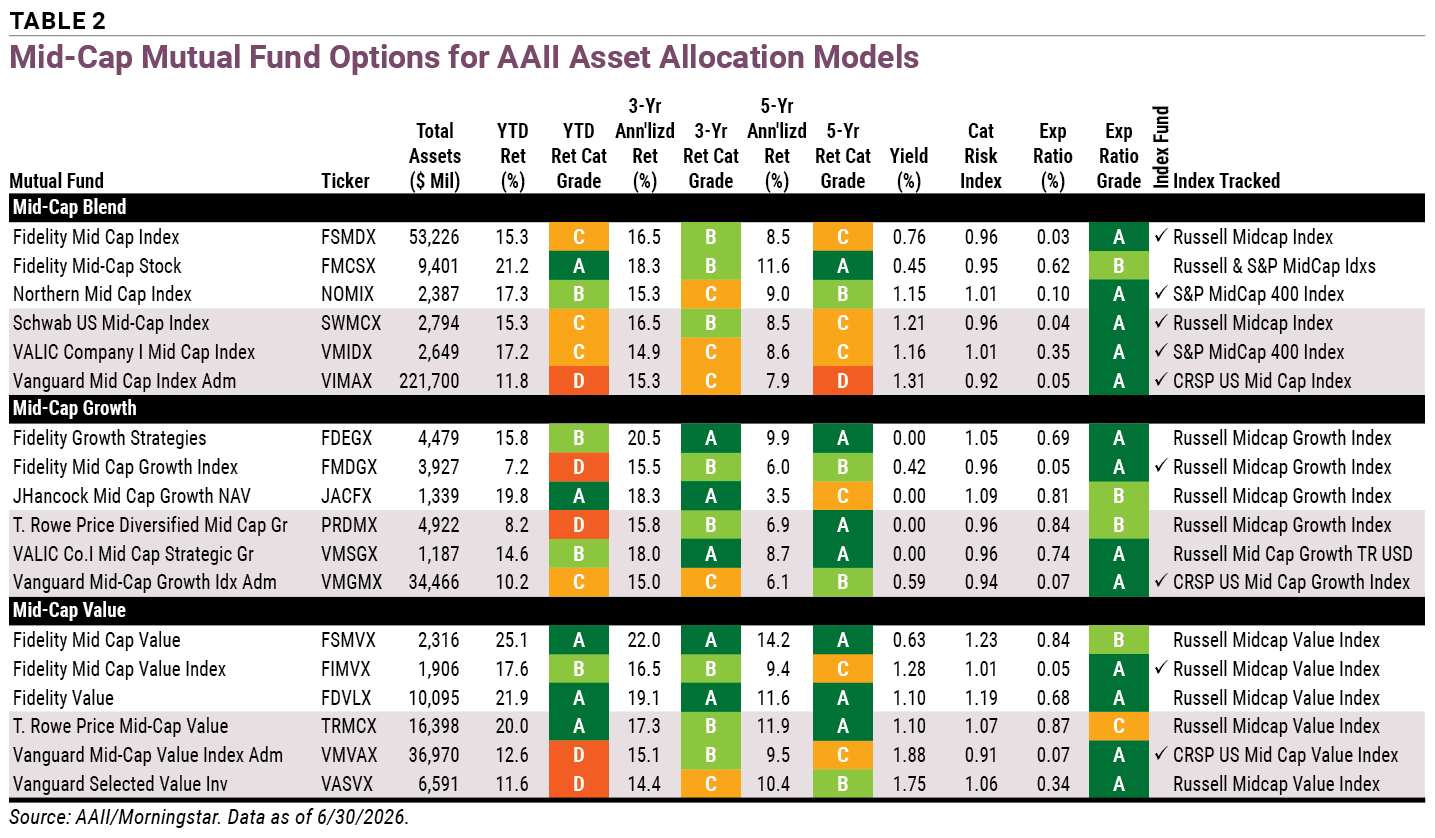
Tables 1 and 2 include mid-cap ETFs and mutual funds, respectively, that might be considered to fulfill the mid-cap portion of one of the AAII Asset Allocation Models.
Only funds with at least a five-year history were considered. Returns for the year-to-date, three-year annualized and five-year annualized periods were generally required to rank in the range of 40% to 100% within their category, resulting in strong AAII A+ Investor Grades for performance.
ETFs were required to have at least $100 million in assets and average daily trading volume of at least 10,000 shares. Higher trading activity can enhance pricing efficiency and improve liquidity, making it easier for investors to enter and exit positions.
Mutual funds were required to be identified by Morningstar as true no-load funds and open to new investors. None are classified as adviser, institutional, other, retirement or S class shares. A maximum purchase amount of $50,000 or less applies to all mutual funds. Individual investors must be able to purchase funds directly through a brokerage account. Funds were required to have assets greater than $50 million.
Expense ratios were required to be lower than the category average. The majority of the ETFs and mutual funds in the tables have A+ Investor Grades of A or B for their expense ratios.
Multi-cap funds that are categorized as mid-cap blend by Morningstar were excluded. These funds provide broad market access as opposed to specifically targeting mid-cap stocks. However, their inclusion in the mid-cap categories affects the relative returns used to assign A+ Investor Grades to the pure mid-cap ETFs and mutual funds listed here.
Table 1 presents ETFs that could be used for mid-cap stock allocation. All are index funds.
Download the Excel spreadsheet for Table 1.
These ETFs are intended for investors who want broad exposure to mid-cap stocks.
iShares Core S&P Mid-Cap ETF  (IJH) is the biggest ETF in the table in terms of size, with $124.3 billion in assets. It tracks the S&P MidCap 400. This is why its performance nearly mirrors the returns of State Street SPDR Portfolio S&P 400 Mid Cap ETF (SPMD) and Vanguard S&P Mid-Cap 400 ETF (IVOO).
There is little difference between these three ETFs. Investors who hold one of them in a taxable account may not find the advantages of switching large enough to offset the tax cost of realizing capital gains.
Among the mid-cap blend ETFs in Table 1, Schwab US Mid-Cap ETF (SCHM) has the highest year-to-date and three-year annualized returns: 23.3% and 17.6%, respectively. It tracks the Dow Jones U.S. Mid-Cap Total Stock Market index. This index tracks the 501st- to 1,000th-largest U.S. companies based on market cap. This is a larger universe of stocks than tracked by the S&P MidCap 400. Schwab US Mid-Cap also ties with State Street SPDR Portfolio S&P 400 Mid Cap for the lowest expense ratio in Table 1 at 0.03%.
iShares Morningstar Mid-Cap ETF (IMCB) has the highest five-year annualized return in the table’s mid-cap blend ETF group at 9.2%. It also has the highest yield in the group at 1.22%. The ETF tracks the Morningstar US Mid Cap Market index, which targets stocks whose market caps rank between the 70th and 90th percentiles in terms of size.
These ETFs target mid-cap stocks with growth characteristics.
Three of the four track the S&P MidCap 400 Growth index. This index measures constituents from the S&P MidCap 400 that are classified as growth stocks based on sales growth, the ratio of earnings change to price, and momentum.
iShares S&P Mid-Cap 400 Growth ETF (IJK) has a below-average grade of D for its three-year annualized return. This is due to very fractional underperformance and the smaller size of the mid-cap growth category. Grades are assigned on a quintile basis, and the mathematical cutoffs can be based on a fraction of a decimal point. The ETF has the highest expense ratio among the mid-cap growth ETFs in Table 1 at 0.17%.
iShares Morningstar Mid-Cap Growth ETF (IMCG) tracks the Morningstar U.S. Mid Cap Broad Growth index, which considers factors such as above-average earnings, sales, cash flow and book value growth. This ETF has the highest year-to-date and three-year annualized returns among the mid-cap growth ETFs, at 23.3% and 18.2%, respectively. It also has the lowest expense ratio of the group at 0.06%.
These ETFs target mid-cap stocks with value characteristics.
Funds with lower expense ratios often outperform their more costly peers, but this isn’t the case for this category. Vanguard Mid-Cap Value ETF (VOE) has a grade of A for its expense ratio (0.05%) but has grades of C (average) for its year-to-date (12.6%) return, as well as its three-year (15.1%) and five-year (9.5%) annualized returns.
Likewise, iShares Morningstar Mid-Cap Value ETF (IMCV) has a low expense ratio (0.06%), but its year-to-date return of 12.1% and its five-year annualized return of 9.8% result in grades of C as well.
Invesco S&P MidCap 400 Revenue ETF (RWK) has the highest expense ratio of all ETFs in Table 1 at 0.39%. However, it has A+ Investor Grades of A for its year-to-date and five-year annualized returns and a grade of B for its three-year annualized return. This ETF adds an interesting twist to the mid-cap space by using an index that weights components by their revenue instead of their market cap. A stock’s weight in the index depends on how much revenue the company earns compared to the total revenue earned by all the stocks in the index.
Unlike market-weighted indexes, revenue-weighted indexes are not affected by investor expectations for index components, which can give revenue-weighted portfolios a systemic bias toward value. To prevent a few big companies from dominating performance, stock weights are capped at 5% in the index.
Table 2 presents mutual funds that could be used for mid-cap stock allocation. All are no-load funds. The table includes a mix of index funds and actively managed funds.
Download the Excel spreadsheet for Table 2.
Like the mid-cap blend ETFs, these mutual funds are intended for investors who want broad exposure to mid-cap stocks.
An actively managed mutual fund leads in terms of performance: Fidelity Mid-Cap Stock fund (FMCSX). It targets “emerging growth stocks” with market caps between $1 billion and $10 billion across the growth-to-value universe. The mutual fund’s expense ratio of 0.62% is well above its index fund peers but reasonable for active management.
Fidelity Mid Cap Index fund (FSMDX) has a similar name, but it is an index fund. It and Schwab US Mid-Cap Index fund (SWMCX) track the Russell Midcap. There is little separation between these two mutual funds, so if you’re deciding between them, select whichever fund is available on your investment platform on a transaction-free basis.
Vanguard Mid Cap Index Admiral fund (VIMAX) is the mutual fund used in the AAII Asset Allocation Models. It tracks the CRSP US Mid Cap index, which targets companies between the top 70% and 85% of investable market caps. The fund’s category risk index of 0.92 implies that it has the lowest volatility of the mid-cap blend mutual funds shown. (The ETF share class of this mutual fund is Vanguard S&P Mid-Cap 400, which is mentioned above.)
Only Northern Mid Cap Index fund (NOMIX) and VALIC Company I Mid Cap Index fund (VMIDX) track the S&P MidCap 400. The former fund has a much lower expense ratio than the latter—0.10% compared to 0.35%.
Fidelity Mid Cap Growth Index fund (FMDGX) and Vanguard Mid-Cap Growth Index Admiral fund (VMGMX) are the only index funds in this group. Whereas the Vanguard fund tracks the CRSP US Mid Cap Growth, the Fidelity fund tracks the Russell Midcap Growth index, which comprises mid-cap stocks with relatively higher price-to-book-value (P/B) ratios, higher two-year projected growth and higher historical five-year sales growth. The Vanguard fund has a slight advantage over the Fidelity fund in terms of five-year annualized return. The Fidelity fund is marginally cheaper with a 0.05% expense ratio.
Fidelity Growth Strategies fund (FDEGX) leads the mid-cap growth mutual funds in terms of three- and five-year annualized returns: 20.5% and 9.9%, respectively. Its expense ratio is high at 0.69% but still rates a grade of A for its category.
John Hancock Mid Cap Growth NAV fund (JACFX) has experienced the greatest volatility in its returns. The fund was up 19.8% during the first half of 2026, but its five-year annualized return is just 3.5%. Its two long-tenured managers seek out companies that exhibit sustainable and durable growth.
Of the mid-cap value mutual funds in Table 2, only two are index funds: Fidelity Mid Cap Value Index fund (FIMVX) and Vanguard Mid-Cap Value Index Admiral fund (VMVAX). Fee-conscious investors will note that they also have the lowest expense ratios in the group—0.05% and 0.07%, respectively.
Of the actively managed mutual funds, two have performed well despite their high expense ratios. Both Fidelity Mid Cap Value fund (FSMVX) and Fidelity Value fund (FDVLX) have A+ Investor Grades of A for their year-to-date returns, as well as their three- and five-year annualized returns. The two funds have experienced greater volatility than their peers, however, as can be seen in their category risk scores.
Fidelity Mid Cap Value uses bottom-up fundamental analysis to identify stocks that have the potential for above-average returns.
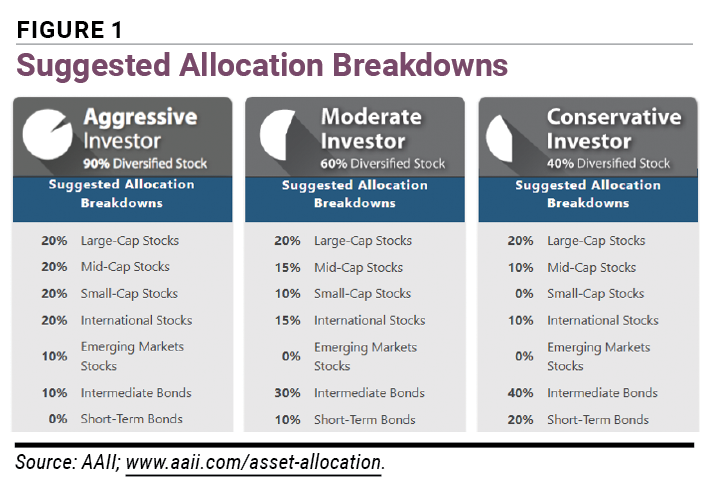
The AAII Asset Allocation Models suggest a 20% allocation to mid-cap stocks for aggressive investors. The suggested allocation is 15% for moderate investors and 10% for conservative investors (Figure 1).
An alternative to owning mid-cap funds is to hold either a broad market fund like Vanguard Total Stock Market ETF (VTI) or an equal-weight fund like Invesco Russell 1000 Equal Weight ETF (EQAL). Doing so provides simplicity at the expense of not getting the full benefit of having direct exposure to mid-cap stocks.
The growth and value mid-cap funds listed in Tables 1 and 2 provide a way to tilt your portfolio toward a preferred style. You could also pair them by combining a growth mid-cap ETF or mutual fund with a value/dividend mid-cap ETF or mutual fund.
AAII members have access to portfolio and performance data through the ETF and Mutual Fund Evaluators. You can use the Evaluator as a starting place to learn more about a fund’s characteristics. To access a fund’s Evaluator page, type its name or ticker symbol into the search box at the top of any AAII.com page. Those interested in learning more about asset allocation and the AAII Asset Allocation Models can visit the Asset Allocation page.
AAII’s My Portfolio allows you to track your ETF and mutual fund holdings, as well as any funds you are interested in. We are adding the ability to use My Portfolio’s Custom View Builder to select the specific traits (return, expense ratio, yield, etc.) you want to monitor.
When considering an index fund, pay attention to how it actually tracks the index named. Two funds with similar names can reveal differences in their returns. Most of the indexes mentioned here are market-cap weighted. This means that the largest companies in the index will have the greatest influence on returns and the smallest companies will have the least impact. Understanding the index construction and methodology helps ensure that you make informed decisions and select funds that align with your objectives.
Also, consider how much you want to specifically target each component of an asset allocation model versus your desire to hold fewer funds.
Portfolio Strategies

ETFs and Mutual Funds


BARRY J from TX posted 2 months ago:
Vinod N from MA posted 2 months ago:
BARRY J from TX posted 2 months ago:
You need to log in as a registered AAII user before commenting.
Log InCreate an account