

August Charts of Interest: 30-Year Bonds Make Headlines
by Charles Rotblut | August 20, 2026
“There is an old saying: The bond market is supposed to be quiet, and it is a big deal when it is not,” wrote Arun Sundaram of CFRA Research at the start of his weekly U.S. Investment Policy Notes email. Since the long end of the bond market has certainly not been quiet, this month’s charts of interest starts by looking at yields on the 30-year Treasury bond for a second consecutive month. We then look at the volatility within the S&P 500 index, bullish earnings guidance, investor returns from risky exchange-traded funds (ETFs) and the higher cost of flying.
As a reminder, the charts of interest highlight charts and tables I’ve come across that haven’t made their way into other AAII commentaries.
Rising Long Yields Aren’t Just a U.S. Story
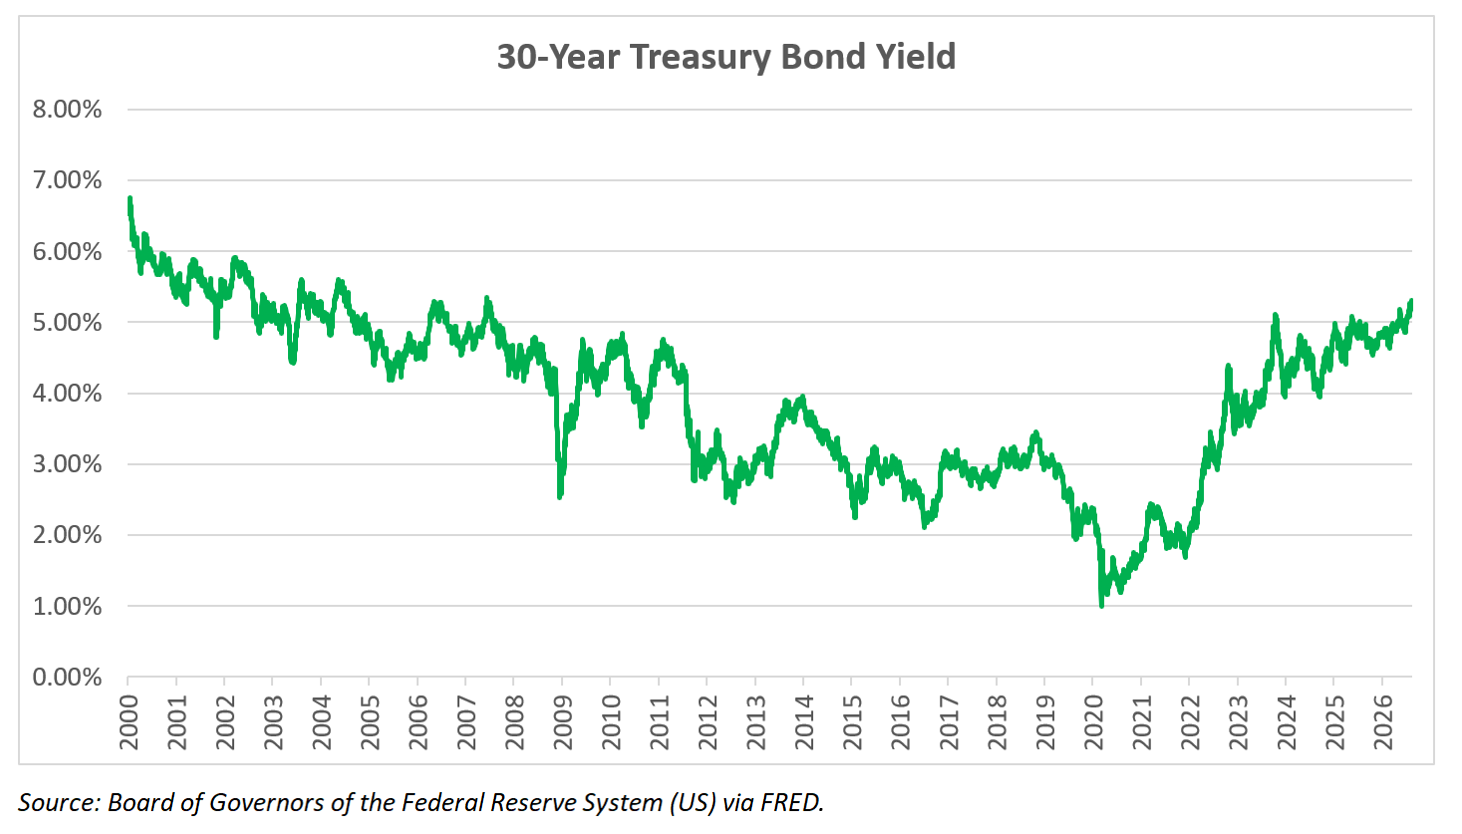
Yields on the 30-year Treasury bond reached 5.31% on Tuesday, their highest level in more than two decades. The increase led Secretary of the Treasury Scott Bessent to announce a plan to repurchase longer-dated Treasury bonds. Yields pulled back slightly yesterday in response to the announcement, but they edged back up this morning to 5.23%.
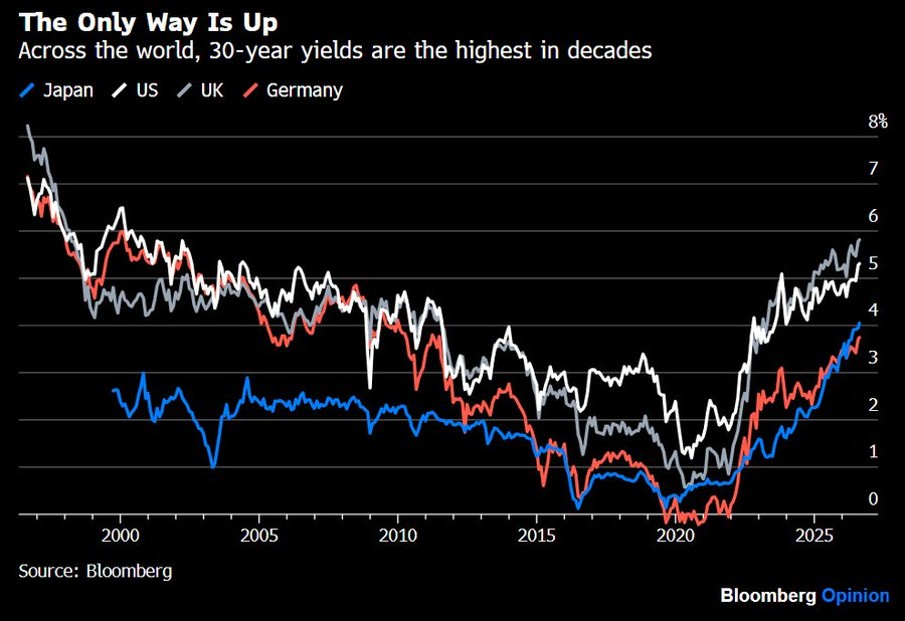
Other developed countries have also seen yields on their long bonds rise. Here’s a chart that was posted yesterday by investment research company Hedgeye Risk Management LLC.
The S&P 500’s Constituents Are More Volatile Than the Index
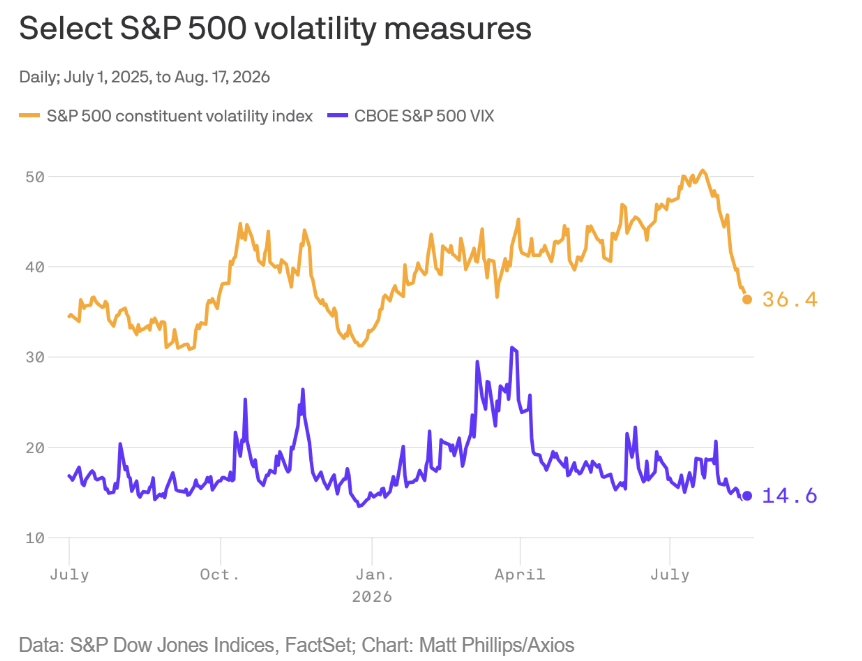
The Cboe S&P 500 Constituent Volatility index jumped above 50 in July. The index has been at or above this level only twice before in the last 10 years. “Unlike those previous panicky episodes, the key gauge of index level volatility for the S&P 500—not its individual constituents—barely budged this time,” observed Matt Phillips of Axios Markets.
(The Cboe S&P 500 Constituent Volatility measures the expected volatility of individual stocks within the S&P 500.)
Phillips attributes last month’s spike to big hedge funds using the options market to bet against big swings in the S&P 500 index while also betting on choppiness for individual stocks. The rebound in oil prices and reaction to Kevin Warsh’s first press conference as Federal Reserve chairman were also cited as reasons.
Companies Across Sectors Are Raising Their Guidance
Nearly one-third of technology companies have raised their guidance this earnings season, far above the 10- and 25-year averages. It’s not just technology companies, though. According to Bespoke Investment Group, stocks in the healthcare, real estate and industrials sectors are also raising guidance at double the historical rate.
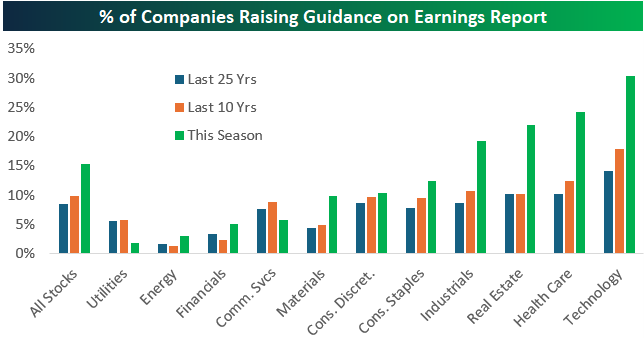
Source: Bespoke Investment Group.
Risky ETFs and Investor Behavior Are a Bad Mix
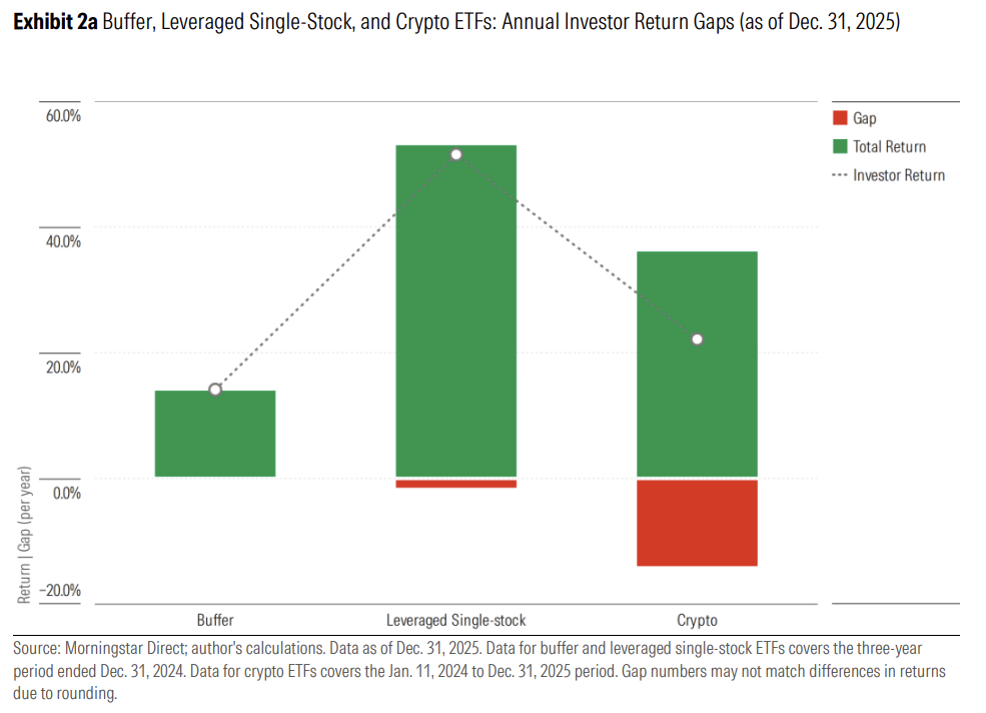
Morningstar included new analysis in its latest Mind the Gap study: the returns realized by investors in buffer, single-stock and cryptocurrency ETFs versus the returns of the funds themselves. Shareholders of buffer funds appeared to have bought and held them—exactly what they should have done.
But the same cannot be said for those investors in the far riskier leveraged single-stock ETFs and cryptocurrency ETFs. “Leveraged single-stock ETF investors notched lofty dollar-weighted gains but still failed to top the unleveraged returns of the stocks they reference. Lastly, investors in [cryptocurrency] ETFs struggled to time their transactions, with their aggregate dollar-weighted return significantly lagging the ETFs’ aggregate total returns,” stated Morningstar managing director Jeffrey Ptak and his colleagues.
It’s More Expensive to Cram Into That Airplane Seat
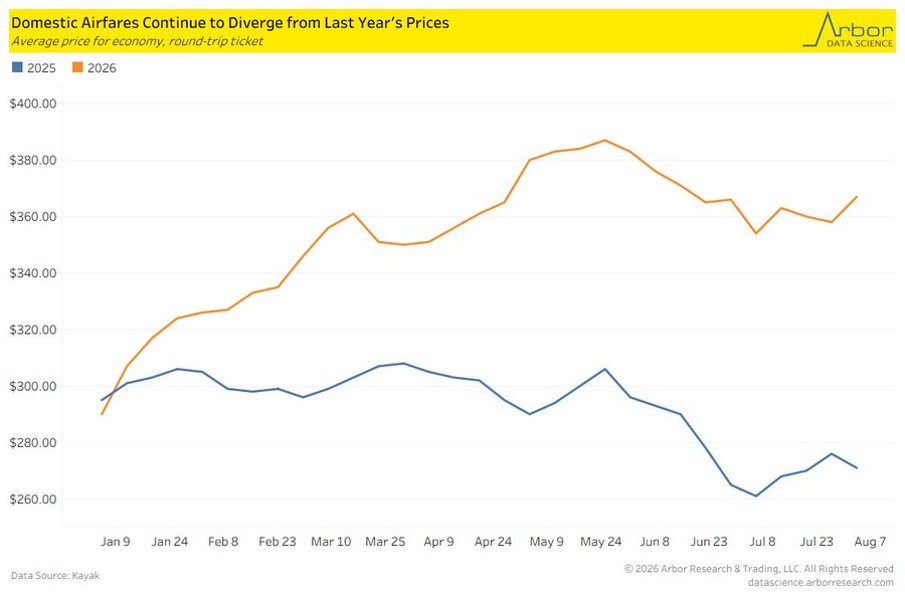
“Domestic travel remains sky high compared to 2025, with the average round-trip economy ticket costing nearly $100 more in 2026,” Charles Schwab’s Liz Ann Sonders posted on X with this chart from Arbor Data Science. Unfortunately, coach seats have not gotten any bigger.
Rising jet fuel prices are primarily to blame for the higher ticket prices. Airlines are to blame for the lack of leg room.

-
Are You Fully Covered? Not If Your Portfolio Is Wearing Buffer ETFs and Mutual Funds
These nontraditional equity funds use options contracts to offer downside protection, but potential gains are limited. -
Understanding and Evaluating Digital-Asset Mutual Funds and ETFs
ETFs, and mutual funds to a limited extent, pave the way for individual investors to gain exposure to cryptocurrency and other securities in the digital-asset ecosystem. -
A New Form of Share Ownership: Issuer-Sponsored Tokens
With an IST, the token is the security and is held in a digital wallet. Read the August 2026 AAII Journal to find out more about this new form of stock ownership.
AAII Sentiment Survey
Neutral sentiment among individual investors about the short-term outlook for stocks decreased in the latest AAII Sentiment Survey. Meanwhile, optimism and pessimism increased.
Bullish sentiment, expectations that stock prices will rise over the next six months, increased 0.8 percentage points to 35.5%. Bullish sentiment is below its historical average of 37.5% for the fifth consecutive week.
Neutral sentiment, expectations that stock prices will stay essentially unchanged over the next six months, decreased 2.8 percentage points to 24.6%. Neutral sentiment is below its historical average of 31.0% for the 24th consecutive week.
Bearish sentiment, expectations that stock prices will fall over the next six months, increased 2.0 percentage points to 39.9%. Bearish sentiment is above its historical average of 31.5% for the 28th consecutive week.
The bull-bear spread (bullish minus bearish sentiment) decreased 1.2 percentage points to –4.4%. The bull-bear spread is below its historical average of 6.5% for the fifth consecutive week.
This week’s special question asked AAII members how they would describe the current valuation of stocks.
Here is how they responded:
- Stocks, in general, are overvalued: 45.1%
- Valuations are mixed, with some stocks expensive and others cheap: 38.5%
- Stocks, in general, are fairly valued: 11.5%
- Stocks, in general, are undervalued: 3.3%
- Not sure/no opinion: 0.8%
Bullish: 35.5%, up 0.8 points
Neutral: 24.6%, down 2.8 points
Bearish: 39.9%, up 2.0 points
Bullish: 37.5%
Neutral: 31.0%
Bearish: 31.5%
See more Sentiment Survey results.

August 13, 2026 Can AI Help Manage Your Portfolio?
August 6, 2026 Widening Operating Margins Are Boosting Earnings, for Now
July 30, 2026 Many of This Year's New ETFs Are Speculative or Complex
July 23, 2026 July Charts of Interest: The Widespread Influence of AI Spending

Discussion
Barry from TX posted about 1 month ago:
Charles, #1 Sec of the Treasury Bessent should read the sign Pogo posted in his swamp in 1970 before he wades into the 2026 yields swamp: “We have met the enemy, and he is us.” #2 The “yields swamp” includes (a) LT UST 10s-30s, (b) IG AAAA bonds (like the $1 trillion in capex bonds the 5 hyperscalers and the $500B Goldman Sachs and NVDA recently floated, and (c) the current US large megacaps EPS yields, which are all ensnared up to their figurative “necks” as the US national debt adds $40B to the national debt. #3 The borrowing punchbowl has already intoxicated US, UK, EU, and JPN investors because all their economies (GDP) are based on using the US Dollar, and the selling of LT USTs Mr. Bessent plans will “debase” the USD (decrease its value as a medium of international settlements (per BIS in Early August). #4 Now that the “Too Big to Fail” crowd has poured themselves a tall glass of “High yield” punch and started singing “AULD Lang Syne,” it may be time to resuscitate Dandy Don Meridith to sing. #5 This “swamp juice” party sounds as familiar as “Party Like It’s 2008.” Thus, “We have met the enemy, and HE IS US. Regards.
Barry from TX posted about 1 month ago:
I am a big Liz Ann Sonders fan. I follow her weekly posts. But sorry, Liz, I seriously doubt that airlines are raising seat prices BECAUSE they are paying more for fuel. Many major carriers have locked in "long-term" (up to 3 years) fuel contracts directly with suppliers to mitigate contango. This may be just another PR-manufactured excuse to raise prices on customers so they can increase gross margins, boost yields, and thus stimulate stock prices (as Charles taught in a recent article). Lots of industries have been doing this since tariffs provided cover.
You need to log in as a registered AAII user before commenting.
Create an account